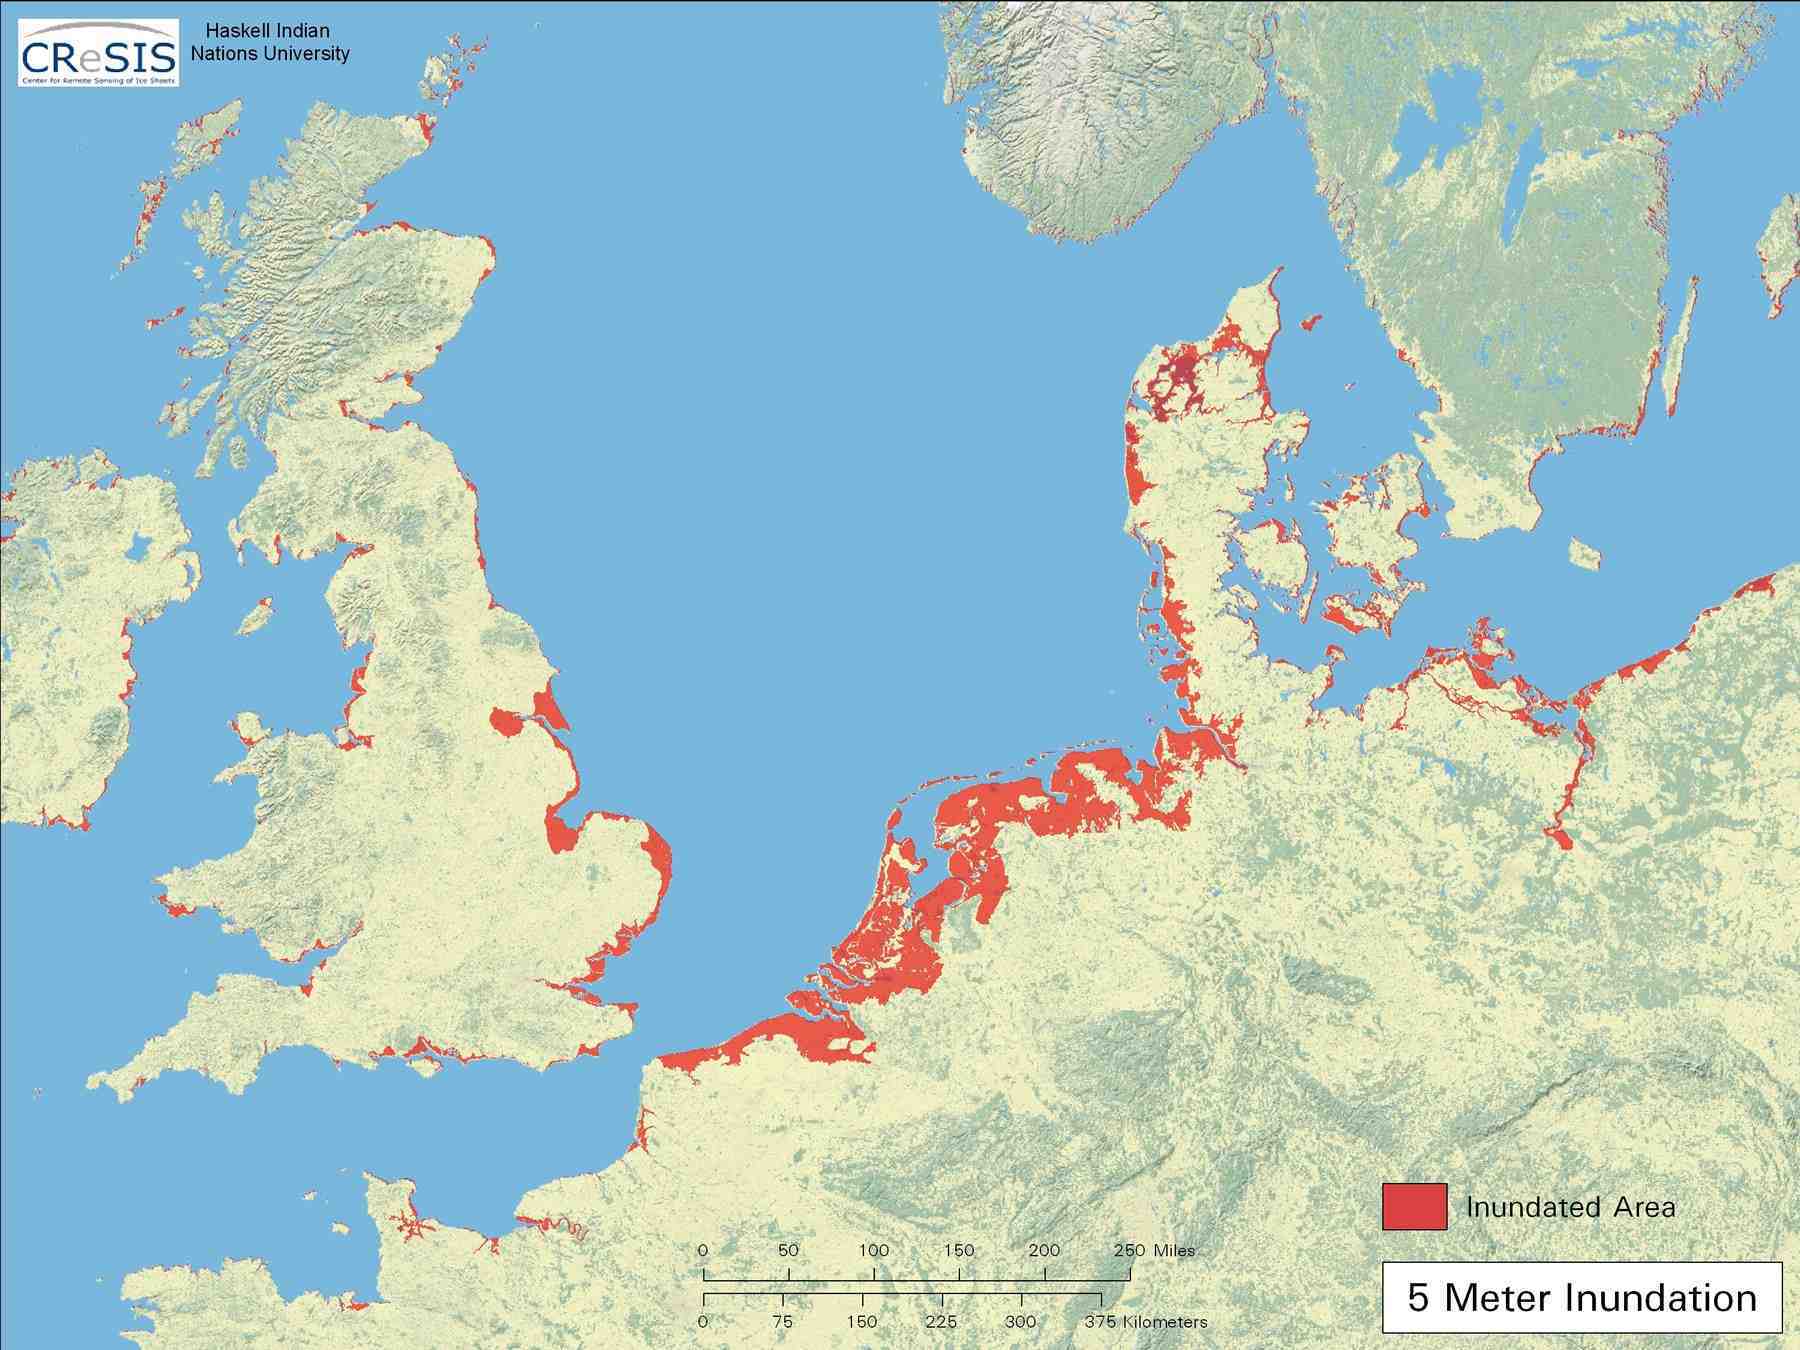
A new paper by Levermann et al. in PNAS uses the record of past rates of sea level rise from palaeo archives and numerical computer models to understand how much sea level rise we can expect per degree of warming in the future. These data suggest that we can expect a global sea level rise of 2.3 m per 1°C of warming within the next 2000 years: well within societal timeframes. A 2°C of warming would result in a global sea level rise of 4.8 m within 2000 years. This would inundate many coastal cities in Europe alone, and cause untold economic and societal damage.
The past is the key to the future

Mean global sea level rose throughout the Twentieth Century, and will continue to rise beyond the year 2100. The current rate of global sea level rise is around 3.1 mm per year. A recent paper by Bamber and Aspinall in Nature Climate indicated that this is likely to rise to 5.4 mm per year by the year 2100, with 62 cm of sea level rise predicted by 2100 AD. This is highly uncertain, and the amount of water melted from the Antarctic and Greenland ice sheets is difficult to quantify.
However, past climate records suggest a sea-level sensitivity of several metres per degree of warming during past intervals of warming on Earth, when temperatures were similar to, or warmer than, present. Sea level rise over the last 100 years has been dominated by ocean warming and glacier melting, but geological records of sea level change in the past indicates that the Greenland and Antarctic Ice Sheets previously gave significant contributions. Combining palaeo-reconstructions with additional strategies can better constrain future sea level rise.
Levermann et al. (2013) used numerical computer numericals to estimate long-term sea-level rise from the four main components of the Earth’s system. They used process-based physical models to give a robust estimate of a sea-level committment on multimillennial timescales up to a maximum increase of 4°C.
Components of sea level rise
Thermal Expansion
As the Earth warms, the oceans expand. Numerical computer models indicate that this will result in a sea level change of 0.2 to 0.63 m per 1°C of warming. The ocean warms in different places at different rates, but a homogenous warming of 1°C would result in a mean global sea level rise of 0.38 m.
Glacier melt

Glaciers are likely to contribute significantly to global sea level rise over the 21st Century, but they are a small player in the longer term. The amount of water that glaciers can contribute to global sea level rise is limited by the relatively small global volume of glacier ice. The total possible contribution is ~0.6 m if all the glaciers on Earth melted. Sensitivity to warming is non-linear, as low-lying glaciers will have largely disappeared with a 4°C warming. The sensitivity of glaciers ranges from 0.21 m per 1°C of warming at pre-industrial temperatures to 0.04 m per 1°C after 4°C of warming.
The Greenland Ice Sheet

The large Greenland Ice Sheet (7 m sea level equivalent) is likely to be a significant contender in global sea level rise over the next few thousand years. The Greenland Ice Sheet shows threshold behaviour during atmospheric warming. Summer temperatures are already high enough to melt the fringes of the ice sheet, so changes in the climate strongly affect the surface mass balance.
The Greenland Ice Sheet will contribute ~0.18 m of sea level rise with a 1°C of warming, and 0.34 m per 1°C of warming between 2°C and 4°C. With this amount of warming, the Greenland Ice Sheet would entirely disappear.
The Antarctic Ice Sheet
Computer simulations run over the last 5 million years show that the Antarctic Ice Sheet (58 m sea level equivalent) has a relatively constant committment of 1.2 m per 1°C of warming. This increase is largely from the marine-based West Antarctic Ice Sheet. The East Antarctic Ice Sheet is unlikely to melt considerably, even with a 4°C of warming, though there is evidence it may have partially melted during the Miocene, resulting in 20 m of sea level rise.
Sea level committment over the next 2000 years

On a 2000 year timescale, the total global contribution to sea level rise is 2.3 m per °C of warming. A 2°C warming (which would mean stabilising carbon dioxide at 450 ppm) is widely touted by many nations as a goal that avoids the most serious impacts of climate change (Rogelj et al., 2009).
Within the next 2000 years, we can expect the collapse of the West Antarctic Ice Sheet (which, as a marine ice sheet, is unstable) and the disappearance of most of the world’s mountain glaciers. These mountain glaciers are relied upon by millions of people for water resources and crop irrigation. After 2000 years, ocean warming will have equilibriated, as will the contribution from mountain glaciers and ice caps.
Conclusions
Estimating future sea level rise over different time scales (100 years, 1000 years, 2000 years) is difficult, with large uncertainties in the dynamics of ice sheets making exact predictions difficult. However, rates of sea level change in the past are useful for constraining predictions over longer timescales. These estimates show that a 2°C of warming would have catastrophic effects for humanity, with the collapse of the large ice sheets and melting away of land glaciers and small ice caps. A sea level rise of this magnitude would result in the inundation of many of the world’s large coastal cities. Even if global temperatures peak by the end of this century, the sea level is likely to keep on rising for centuries to come, as the oceans, glaciers and ice sheets take time to equilibriate. 187 million people are already set to be displaced by the end of this century with just a 62 cm increase in global sea levels. The economic and societal cost will be huge. We need to act now to curb emissions and reduce global temperatures and avoid a collapse of the West Antarctic and Greenland ice sheets at all costs.
References
Bamber, J.L. & Aspinall, W.P. An expert judgement assessment of future sea level rise from the ice sheets. Nature Clim. Change 3, 424-427 (2013).
Rogelj, J., Hare, B., Nabel, J., Macey, K., Schaeffer, M., Markmann, K. & Meinshausen, M. Halfway to Copenhagen, no way to 2 [deg]C. 81-83 (2009).
I have my doubts about this paper, on three points specifically:
PRISM reports 25 +/- 12 meters for the mid-Piacenzian with ~2C warming relative to pre-industrial. That the SLR error bars *barely* touch with different temps seems like a poor basis for the claim of consistency.
I think they needed to devote a little discussion to the obvious point that if indeed SLR is fairly linear through +4C, things necessarily go sideways right after that. What’s the physical basis for the break in behavior?
The new Phillips et al. paper (press release seems to invalidate the GIS model relied on by Levermann et al., and would seem to have considerable implications for Antarctica as well.
The paper aside, the Levermann et al. press release used some very strong language about how much confidence should be placed in their results. Was that really justified?
Could you please put your points into simpler language, Steve? I am not sure this forum is for those with limited knowledge, but wondered if you could do this please?
And now this: Antarctic ice shelves melting in interesting places. Science marches on.
It’s ironic that these papers appeared so close on the heels of Levermann et al.
The Rignot et al. 2013 paper has some interesting data on ice shelves, showing massive melting around Pine Island Glacier and some of the Antarctic Peninsula glaciers, for example:
https://www.antarcticglaciers.org/glaciers-and-climate/pine-island-glacier/#SECTION_3
It’s certainly showing massive ice shelf sensitivity to ocean temperature.
And another one, this time evidence for major East Antarctic melt and coastal retreat during the Pliocene. Depressing stuff, even though I’m not really surprised by any of it.
Yet another.
Thanks for pointing out these new and interesting papers, Steve!
This paper says looking at paleoclimate a 1 degree Celsius temperature rise = 2.3 meter GSLR. Another paper: Paleoclimate Implications for Human-Made Climate Change by JE Hansen – 2011 arxiv.org/pdf/1105.0968 says that paleoclimate data tells us a 1 degree Celsius temperature rise = 20 meter GSLR. How could there be this much of a difference?
Very interesting view where the population of earth is fried, boiled or drown. The sun can only deliver a constant amount of heat, as levels of the oceans increase it will absorb more heat. The world may cool and may trigger a global ice age.