This article summarises the following publication:
For a more straightforward summary of this article, go here.
Summary
Globally, glaciers and icefields contribute significantly to sea level rise, and are critical for the world’s water resources. However, these ice masses are shrinking, and that rate of shrinkage is accelerating.
Ice loss from Juneau Icefield, a plateau icefield in Alaska, has been accelerating in recent decades. We reconstructed ice area and volume of Juneau Icefield from 1770 AD (using mapped glacial geomorphology that dated from the ‘Little Ice Age’), 1948, 1979, and then every decade to 2020.
Glaciers shrank 5 times faster from 2015-2019 than from 1979-1990. Glacier volume loss remained fairly consistent (0.65-1.01 km3 a-1) from 1770-1979 AD, rising to 3.08-3.72 km3 a-1 from 1979-2010, and then doubling after 2010 AD, reaching 5.91 ± 0.80 km3 a-1 (2010-2020).
In the last 15 years, thinning has become pervasive across the icefield plateau, accompanied by glacier recession and fragmentation.
Rising equilibrium line altitudes and increasing snow and ice melt across the plateau has driven a series of topographically controlled feedbacks that have accelerated glacier melt, and resulted in the observed acceleration in mass loss. As glacier thinning on the plateau continues, a mass balance-elevation feedback is likely to inhibit future glacier regrowth, potentially pushing glaciers beyond a dynamic tipping point.
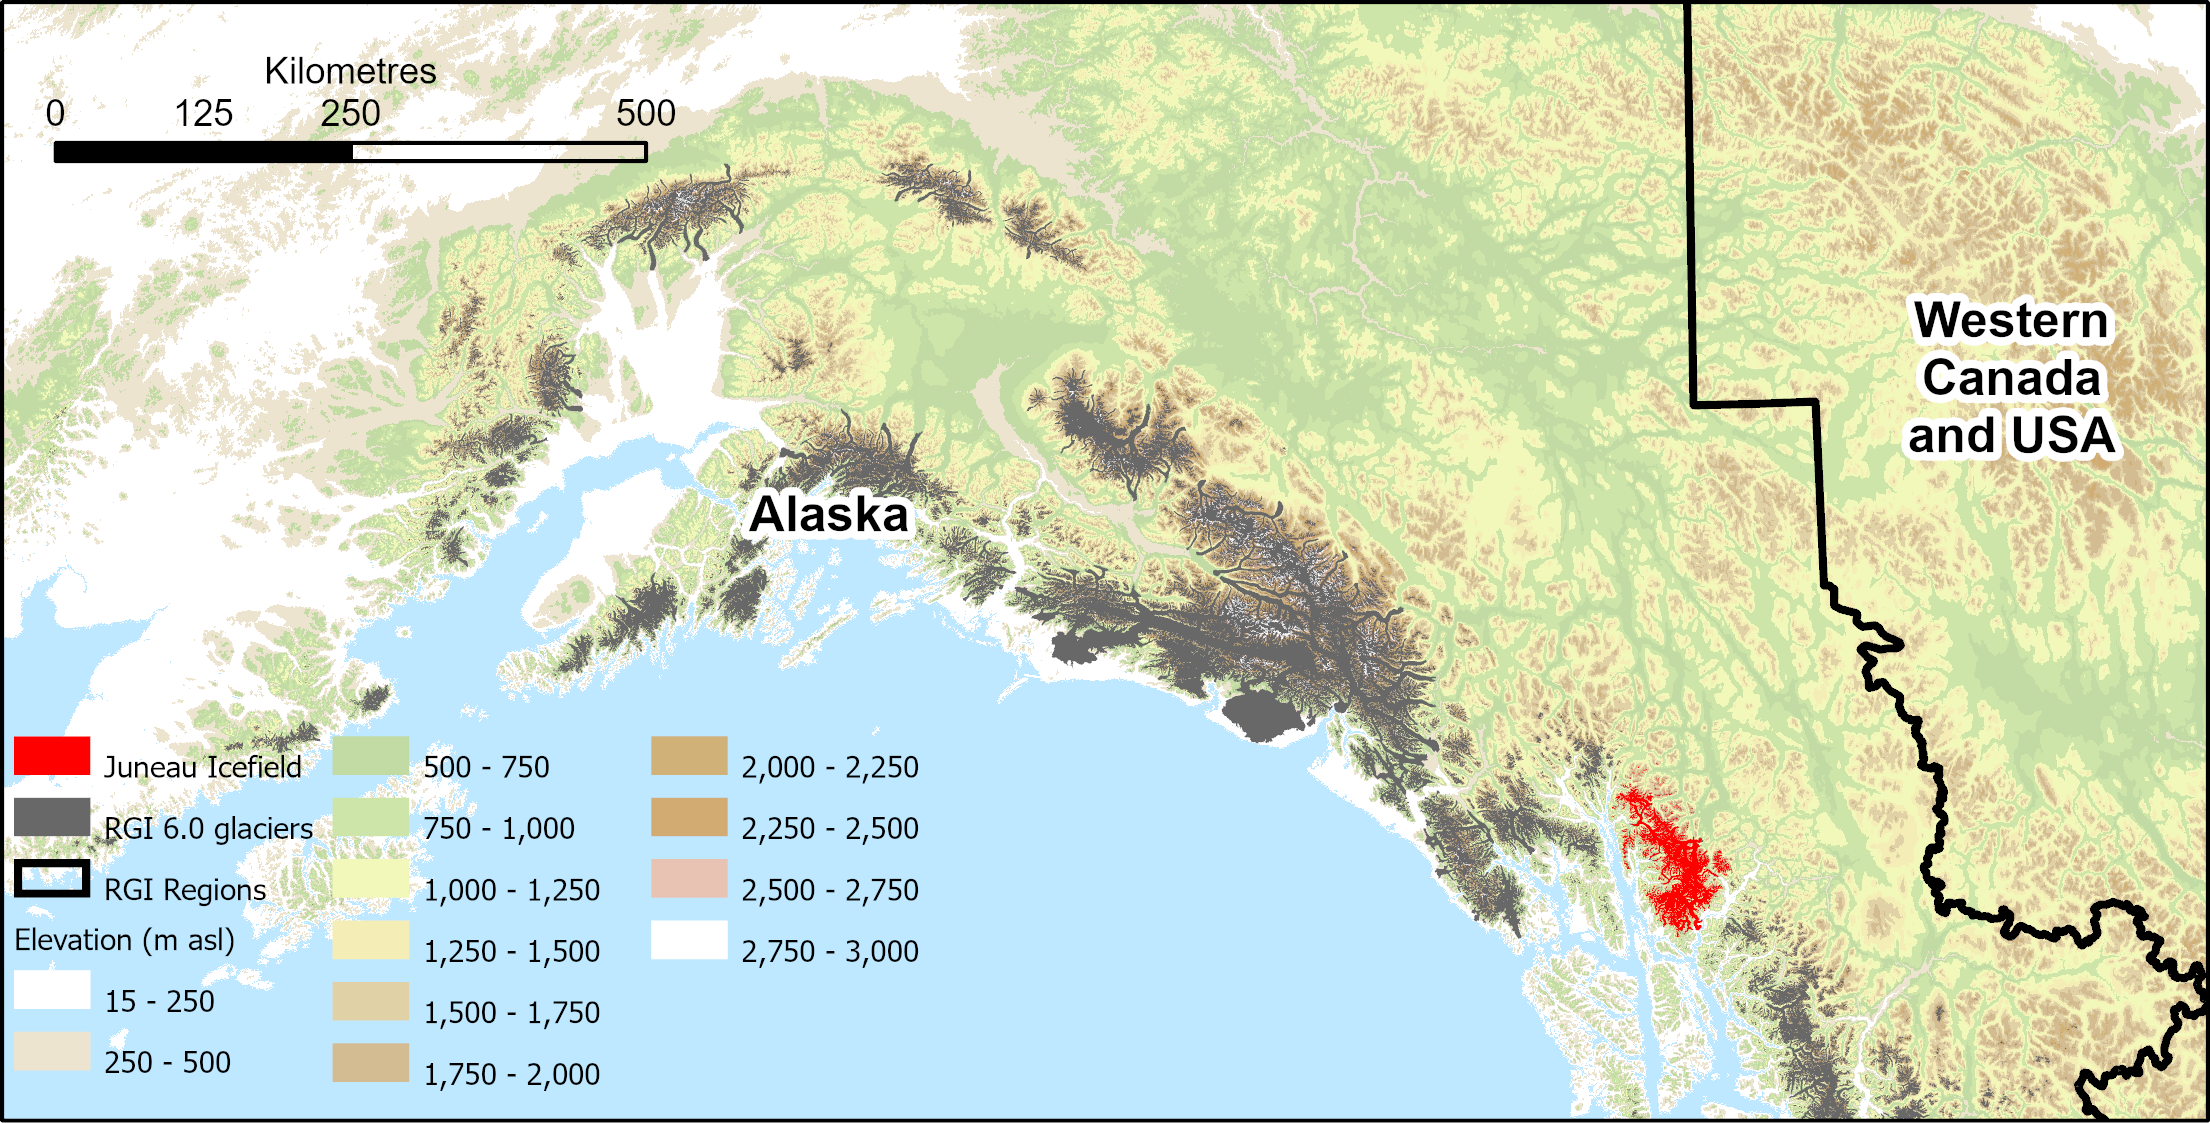
Juneau Icefield, Alaska and British Columbia
Juneau Icefield (northern Coast Mountains) straddles the boundary between Alaska (USA) and British Columbia (Canada). The icefield spans an elevation range of 0-2300 m asl, with a large, low-slope accumulation area (yellow and orange in the map below), covering 1400 km2.

Juneau Icefield had 1050 glaciers in 2019, covering 3816.3 km2 and with an ice volume of 1051.1 ± 301.7 km3.

Most of the glacier area is held in 40 outlet glaciers (2939.1 ± 4.2 km2), which drain directly from the main plateau.

Separate to this plateau are 145 valley glaciers (570.9 ± 2.3 km2), 584 mountain glaciers (279.2 ± 6.4 km2) and 281 glacierets (27.2 ± 3.0 km2).
The photographs below show the large, low-slope plateau accumulation (A, B), and the outlet glaciers draining the plateau (C, Taku Glacier, and D, Gilkey Glacier). The outlet glaciers occupy steep-sided parabolic valleys (D, F) and have moraines relating to the Little Ice Age neoglaciation near their termini (H).

Juneau Icefield is a plateau icefield, and has a large, low-slope accumulation area, as shown in the cartoon below. The equilibrium line altitude (ELA) is the point at the glacier where net accumulation of snow and ice is equal to net mass loss of snow and ice over the course of one year, and is an important metric of the mass balance of a glacier. As temperatures rise and melt increases, the height of the ELA rises and the glacier shrinks in response.


Changing climates at Juneau
In Alaska, the largest recent expansion of glaciers occurred during the “Little Ice Age”, AD 1770-1850 AD, when temperatures were 1.3°C to 2°C cooler than modern. Now, winter temperatures show a strong warming, with a trend of 0.35 °C per decade from 1941–2020. There was an increase in mean winter temperatures of 2.07 °C from 2001–2020 relative to 1941–1970), which has lengthened the summer melt season.
For mean annual air temperatures, six of the ten warmest years have occurred since the year 2000, and the ten coolest years all occurred prior to 1973.
Since records began at Juneau Airport, summer temperatures have also increased, with temperatures from 2001 to 2020 0.97 °C warmer than from 1941 to 1970.

Accelerating glacier change in Juneau Icefield
Rising Equilibrium Line Altitudes (ELAs)
This Juneau Icefield-wide examination of glacier and climate change over this 250-year time period reveals that rates of glacier recession sharply accelerated since 2005, relative to earlier time periods. Observed rates of glacier volume and area loss are rapidly accelerating, demonstrating a threshold response to a warming climate, a rising ELA (equilibrium line altitude) and snowlines, and decreasing regional albedos (the reflectivity of the icefield).
The figure below shows how the ELA (the end-of-summer snowline) is rising to intersect and rise above the plateau.

Glacier shrinkage across Juneau Icefield
Overall, rates of glacier areal recession rose slowly from 1948-2005, followed by a sharp acceleration in rates of glacier area loss after 2005. Icefield-wide, rates of glacier area shrinkage were 7 times faster from 2015-2019 relative to 1948-1979, and 5 times faster relative to 1979-1990.
There are three distinct periods in icefield volume loss, with relatively consistent rates from LIA-1979, followed by a rise from 1979-2010, and a doubling of rates of volume loss after 2010 (Figure d below). There has thus been a steep acceleration in the rate of ice mass loss across the icefield since the early twenty-first century.

The map below shows the glacier extents for all glaciers of Juneau Icefield. The orange-yellow denotes the extent of the interconnected plateau, and the black lines show the end-of-summer snowline height on the plateau.

1770 – 1948
Most glaciers (91%) receded substantially from their LIA extent between 1770 and 1948 AD and total glacier area shrank by 12.18 % at a rate of 0.07 % a-1. This was accompanied by a conservative estimate of volume loss of 0.65 ± 0.92 km3 a-1. Most glaciers (91%) receded substantially from their LIA extent between 1770 and 1948 AD and total glacier area shrank by 12.18 % at a rate of 0.07 % a-1
| Year | Total glacier area (km2) | Count of glaciers | Δ Area (km2) | Total rate of glacier ΔA (km2 a-1) | Rate of glacier ΔA (% a-1) | No. Advancing |
| 1770 | 5415.0 ± 111.8 | 1158 | ||||
| 1948 | 4755.5 ± 26.0 | 1118 | -659.0 ± 137.7 | -3.7 | -0.07 | 67 |
| 1979 | 4584.0 ± 97.6 | 1118 | -171.6 ± 123.6 | -5.5 | -0.12 | 342 |
| 1990 | 4496.1 ± 55.8 | 1117 | -87.9 ± 153.4 | -8.3 | -0.18 | 387 |
| 2005 | 4238.7 ± 47.7 | 1114 | -258.8 ± 103.5 | -17.4 | -0.39 | 95 |
| 2015 | 4001.5 ± 69.4 | 1102 | -235.8 ± 117.1 | -25.8 | -0.60 | 0 |
| 2019 | 3816.3 ± 15.9 | 1050 | -185.1 ± 85.3 | -38.5 | -0.96 | 5 |
| Total change | -108 | -1598.6 ± 127.6 |
1948-1979
Between 1948 and 1979 AD, 342 (30.6%) glaciers advanced, and overall rates of glacier recession were slow (0.12 % a-1). This was likely caused by an increase in snowfall relative to the period before 1948. Most advancing glaciers were either small mountain glaciers or glacierets, likely reflecting their faster response time. Despite these changes, a comparatively low rate of thinning persisted, at an icefield-wide average of 0.11 m a-1.
1979 – 2005
Slower rates of area loss and thinning continued until 1979, followed by an acceleration of ice loss during the latter 20th and start of the 21st centuries. Fewer (8.5 %) glaciers advanced between 1990 and 2005 (n = 95). Rates of glacier area loss rose, reaching 0.18 % a-1 (8.33 km2 a-1, 1979-1990), and then sharply accelerated to 0.39 % a-1 (17.54 km2 a-1, 1990-2005).
From 1979-2000, icefield-wide volume loss reached 3.7 ± 1.6 km3 a-1 (d in the figure above), also indicating a sharp acceleration from the preceding periods, with a mean thinning of -0.48 m a-1 across all glaciers (c in the figure above). Glacier tongues thinned across the icefield, with thinning reaching higher elevations up-glacier than before. Thinning reached elevations of 1380 m asl on Mendenhall Glacier, 1490 m for Tulsequah Glacier, and the plateau at 1550 m for Meade Glacier.
The map below shows glacier recession at Mendenhall Glacier, Lemon Creek Glacier, Taku Glacier and Norris Glacier from 1770-2019 AD. The dashed black lines show the historical (written and mapped) records of glacier extent, and the circles show where glacier tongues have separated (blue dots) or glaciers have fragmented in the along-flow direction (disconnected; pink).

2005 – 2020
This rate of ice loss continued into the 21st century. Between 2005-2015 AD, 99% of glaciers receded, and 10% of glaciers disappeared between 2005 and 2019 AD. From 2005 onwards, glacier areal loss accelerated sharply relative to previous time periods, reaching 0.60 % a-1 (25.36 km2 a-1, 2005-2015) and then 0.96 % a-1 (38.47 km2 a-1, 2015-2019) (b-g in the figure above). Rates of recession were 1.5 times faster from 2015-2019 than from 2005-2015.
Icefield outlet glaciers experienced severe volume loss after 2010 (Figure c and g above), with thinning across the icefield plateau at elevations of up to 1800 m asl and volume loss at a rate of 5.91 ± 0.8 km3 a-1 (2010-2020). The whole icefield loss equated to 5% of the total volume reconstructed in 2017-18 by Millan et al. 2022 from 2010-2020.
Alongside this thinning we observe increased glacier fragmentation, with both terminus separation and glacier disconnections (sensu Davies et al. 2022), where glacier tributaries are detached from their accumulation areas, occurring increasingly frequently.
| Time period | Volume Change | ||
| Volume change per annum (km3 a-1) | Total volume change (km3) | Cumulative volume change (km3) | |
| 1770 – 2013 | -0.4 ± 0.1 | -95.26 ± 17.01 | |
| 1770 – 1948 | -0.7 ± 0.9 | -115.9 ± 163.4 | -115.9 |
| 1650-1948 | -0.4 ± 0.6 | ||
| 1880-1948 | -1.7 ± 2.4 | ||
| 1948 – 1979 | -1.0 ± 0.7 | -31.3 ± 23.0 | -147.2 |
| 1979 – 2000 | -3.7 ± 1.6 | -78.2 ± 33.0 | -225.4 |
| 2000 – 2010 | -3.1 ± 1.0 | -30.8 ± 10.1 | -256.2 |
| 2010 – 2020 | -5.9 ± 0.8 | -59.1 ± 8.0 | -315.3 |
The table below shows how thinning varies across the icefield by glacier type.
| Time period | Mean glacier area-averaged dh/dt (m) ± 95% confidence interval b | ||||
| All glaciers | Glacierets | Mountain Glaciers | Valley Glaciers | Outlet Glaciers | |
| 1770 – 1948 | -0.11 ± 0.01 | -0.12 ± 0.03 | -0.12 ± 0.01 | -0.11 ± 0.03 | -0.10 ± 0.02 |
| 1948 – 1979 | -0.28 ± 0.03 | -0.17 ± 0.06 | -0.28 ± 0.03 | -0.44 ± 0.09 | -0.33 ± 0.11 |
| 1979 – 2000 | -0.51 ± 0.02 | -0.37 ± 0.05 | -0.49 ± 0.03 | -0.73 ± 0.07 | -0.69 ± 0.14 |
| 2000 – 2010 | -0.21 ± 0.04 | -0.10 ± 0.07 | -0.17 ± 0.05 | -0.50 ± 0.09 | -0.45 ± 0.22 |
| 2010 – 2020 | -0.74 ± 0.03 | -0.58 ± 0.05 | -0.69 ± 0.03 | -1.10 ± 0.09 | -1.21 ± 0.21 |
Snowline change at Juneau Icefield
This rapid glacier recession at Juneau Icefield was accompanied by measured ELAs (equilibrium line altitudes) rising to the plateau height in the period 2005-2020 (McNeil et al 2020). Snowlines are reaching the plateau frequently, with both snowlines and ELAs regularly occurring above the plateau height of 1200 m since 2005 and increasingly frequently in the last decade of the study period (k panel in figure above).
These high snowlines resulted in net ablation at the height of many of the icefalls.

Albedo change at Juneau Icefield
The albedo is a measure of how reflective a surface is, measured from 0 (no light reflected) to 1 (all light reflected). It is the proportion of the incident light or radiation that is reflected by a surface, typically that of a planet or moon.

Alongside the trend of rising snowlines at Juneau Icefield, we also observe a decrease in icefield-wide average albedo (Figure l above). The months of September and August in 2018 and 2019, which were characterised by exceptionally high snowlines, likewise had exceptionally low icefield-wide mean albedos of 0.44 to 0.48 respectively.
When comparing the time periods 1987-2009 and 2010-2023, the icefield-wide albedo within the 2019 glacier outlines was lower from 2010-2013 (mean = 0.71, standard deviation = 0.14) than from 1987-2009 (mean = 0.84, standard deviation = 0.08); t (90) = 5.48, p < 0.05. This decrease is caused by more pixels with a lower albedo in summer, especially on the plateau; here, a regression for average albedo over time results in an r2 value of 0.23 (p < 0.05). Many bright pixels with high albedo however remain throughout the study period, especially at higher altitudes on the plateau.
Juneau Icefield fragmentation
The recession and thinning of Juneau Icefield glaciers has resulted in increasing icefield fragmentation. This includes the separation of glacier tongues in the valleys, and disconnections between glacier accumulation zones and the glacier tongue. These occur higher up the glacier, where bare rock appears within the glacier polygon as a result of thinning, usually over thin, steep and heavily crevassed ice such as in icefalls (Davies et al., 2022). Glacier tongues down-stream of glacier disconnections show increased debris cover and enhanced thinning.

These disconnections are occurring at a uniform altitude and slope through time (Figure 6i) but are occurring more frequently after 2005 AD as glacier ELAs increasingly intersect this altitudinal range (panel h in the figure above).
Processes accelerating change at Juneau Icefield
ELA crossing the plateau
The critical driving factor at Juneau Icefield is the rising ELA (equilibrium line altitude), and high late-summer snowlines. These now intersect the plateau, driving thinning across the plateau.
This rising ELA decreases the accumulation area and means that the ratio of accumulation to ablation area (the accumulation area ratio) is declining, and more of the icefield’s area is melting.
The shape of the icefield plateau encourages a strong mass balance response to moderate climate forcing, because the low-slope of the plateau means that it is susceptible to losing large parts of the accumulation area.
In coming decades, this will drive further decrease of the icefield’s accumulation area, and will continue to accelerate glacier recession.
Thinning-fragmentation feedback
The rising ELA and snowline also mean that thinning is occurring at key vulnerable points on the icefield, such as at the steep, heavily crevassed icefalls that bound the plateau.
This encourages fragmentation, and increases exposure of rock within the glacier, further lowering albedo and enhancing melt. Disconnected glaciers stagnate and downwaste once detached in this manner. Thin debris accumulates on the ice surface, darkening the surface and thereby enhancing melt.
The presence of icefalls around the icefield means that with further thinning, more fragmentation and downwasting is inevitable.

Albedo-mass balance feedback
The rising snowlines also are causing a lowering of the icefield’s albedo. As snow cover duration and extent is reduced, darker rock, older snow from previous years (firn) and ice surface is increasingly exposed. These darker surfaces absorb more of the sun’s solar energy, enhancing melt. The effect is likely enhanced by deposition of thin layers of dust and black carbon from tourism, pollution and wildfires.

Elevation-mass balance feedback
As the icefield thins, it will drive an elevation-surface mass balance feedback by lowering the elevation of the icefield plateau. This will drive increased melt in warmer air temperatures, because of the lapse-rate induced rise in air temperatures at lower elevations.

This is fundamentally unstable, as thinning drives increasingly negative mass balances, even without more climate forcing. This results in the inevitable further shrinkage of glaciers and an irreversible tipping point in glacier dynamics.
Methods
We used glacial geomorphological mapping (see here) to reconstruct the LIA geomorphology and then glacier extent and ice thickness of the palaeo-icefield. We then applied structure-from-motion algorithms in MicMac to 20th Century archival aerial photographs (1948 and 1979 AD) as well as topographic maps to reconstruct glacier area and surface elevation in 1948 and 1979.

Satellite imagery was also used in 1990, 2005, 2015 and 2019 to altogether yield glacier outlines from 1770, 1948, 1979, 1990, 2005, 2015 and 2019 AD. ), and original icefield surface DEMs at ~1770, 1948, and 1979 AD. We combined these with datasets of ice surface elevation derived from structure-from-motion algorithms using ASTER imagery from 2000, 2010 and 2020.
Detailed methods are available in the published paper.
Press and Media coverage
The article generated some media attention, including:
- BBC Radio 4 Today Programme live interview (0740 am, 3rd July 2024)
- Radio interview, live, with Scott Schantz, July 9th, 1505 BST. 980 CKNW in Vancouver, Canada
- KTOO Interview. Radio interview with National Public Radio, Juneau.
- TV interview with Aaron Morrison, a meteorologist with Alaska’s News Source out of Anchorage, Alaska.
- Newcastle FROM Blog
- The Conversation
- Associated Press
- The Independent 1
- The Independent 2
- New York Times
- Earth.com
- Wales 247
- Suddeutsche Zeitung
- MailOnline
- The Smithsonian
Read the Newcastle University Press Release.
Data availability
All data used in this work are available open access and source data are provided with this paper. The glacier outlines, source data, and the novel digital elevation models and orthomosaics from the LIA, 1948 and 1979 are available from Mendeley Data (Davies, Bethan (2024), “Juneau Icefield 1770-2020”, Mendeley Data, V3, doi: 10.17632/4djw8z3jrb.3; https://data.mendeley.com/datasets/4djw8z3jrb/2)). Source data are provided with this paper. The updated Juneau Icefield glacier outlines are also available from GLIMS (https://www.glims.org/maps/glims). Shapefiles of geomorphological mapping used in the neoglacial LIA reconstruction are available from Davies et al. 2022.
Historical topographic maps are available from the USGS map viewer (https://ngmdb.usgs.gov/topoview/viewer/#4/52.19/-123.71) as georeferenced GEOTIFFS. Aerial photographs and Landsat and Sentinel satellite imagery are available from USGS Earth Explorer (https://earthexplorer.usgs.gov/). SRTM available from the USGS EROS archive (https://www.usgs.gov/centers/eros/science/usgs-eros-archive-digital-elevation-shuttle-radar-topography-mission-srtm-1). ASTER GDEM V3 available from the NASA Jet Propulsion Laboratory (https://asterweb.jpl.nasa.gov/gdem.asp). DEMs of difference from 2000-2010 and 2010 2020 are available from Hugonnet et al 2021.
Further Reading
Read the two related papers:
Related articles
The glaciers of Juneau Icefield
Structural glaciology of Juneau Icefield