Geographic setting
Patagonia, between ~40°S to 56°S, is the most southerly part of the South American continent. The landscape of this region is one of contrasts. Dense temperate rainforests cover the western coast, whereas the eastern plains are flat, vast, and arid. Perhaps most striking, however, are the high, Patagonian Andes, which rise steeply (up to around 4000 m asl) above deeply carved glacial fjords and valleys, and are home to the Patagonian Icefields.

Climate of Patagonia
Patagonia is one of the windiest and wettest places on Earth. The region has a temperate maritime climate, with a strong west-east precipitation gradient as a result of the year-round passage of westerly winds over the Patagonian Andes(1,2). On the west coast, annual precipitation reaches up to 7,500 mm year, whereas less than 1,500 mm a year falls east of the icefields(3,4). The snowfall brought by the westerly winds are the main source of accumulation for the glaciers of this region.

The Patagonian Icefields
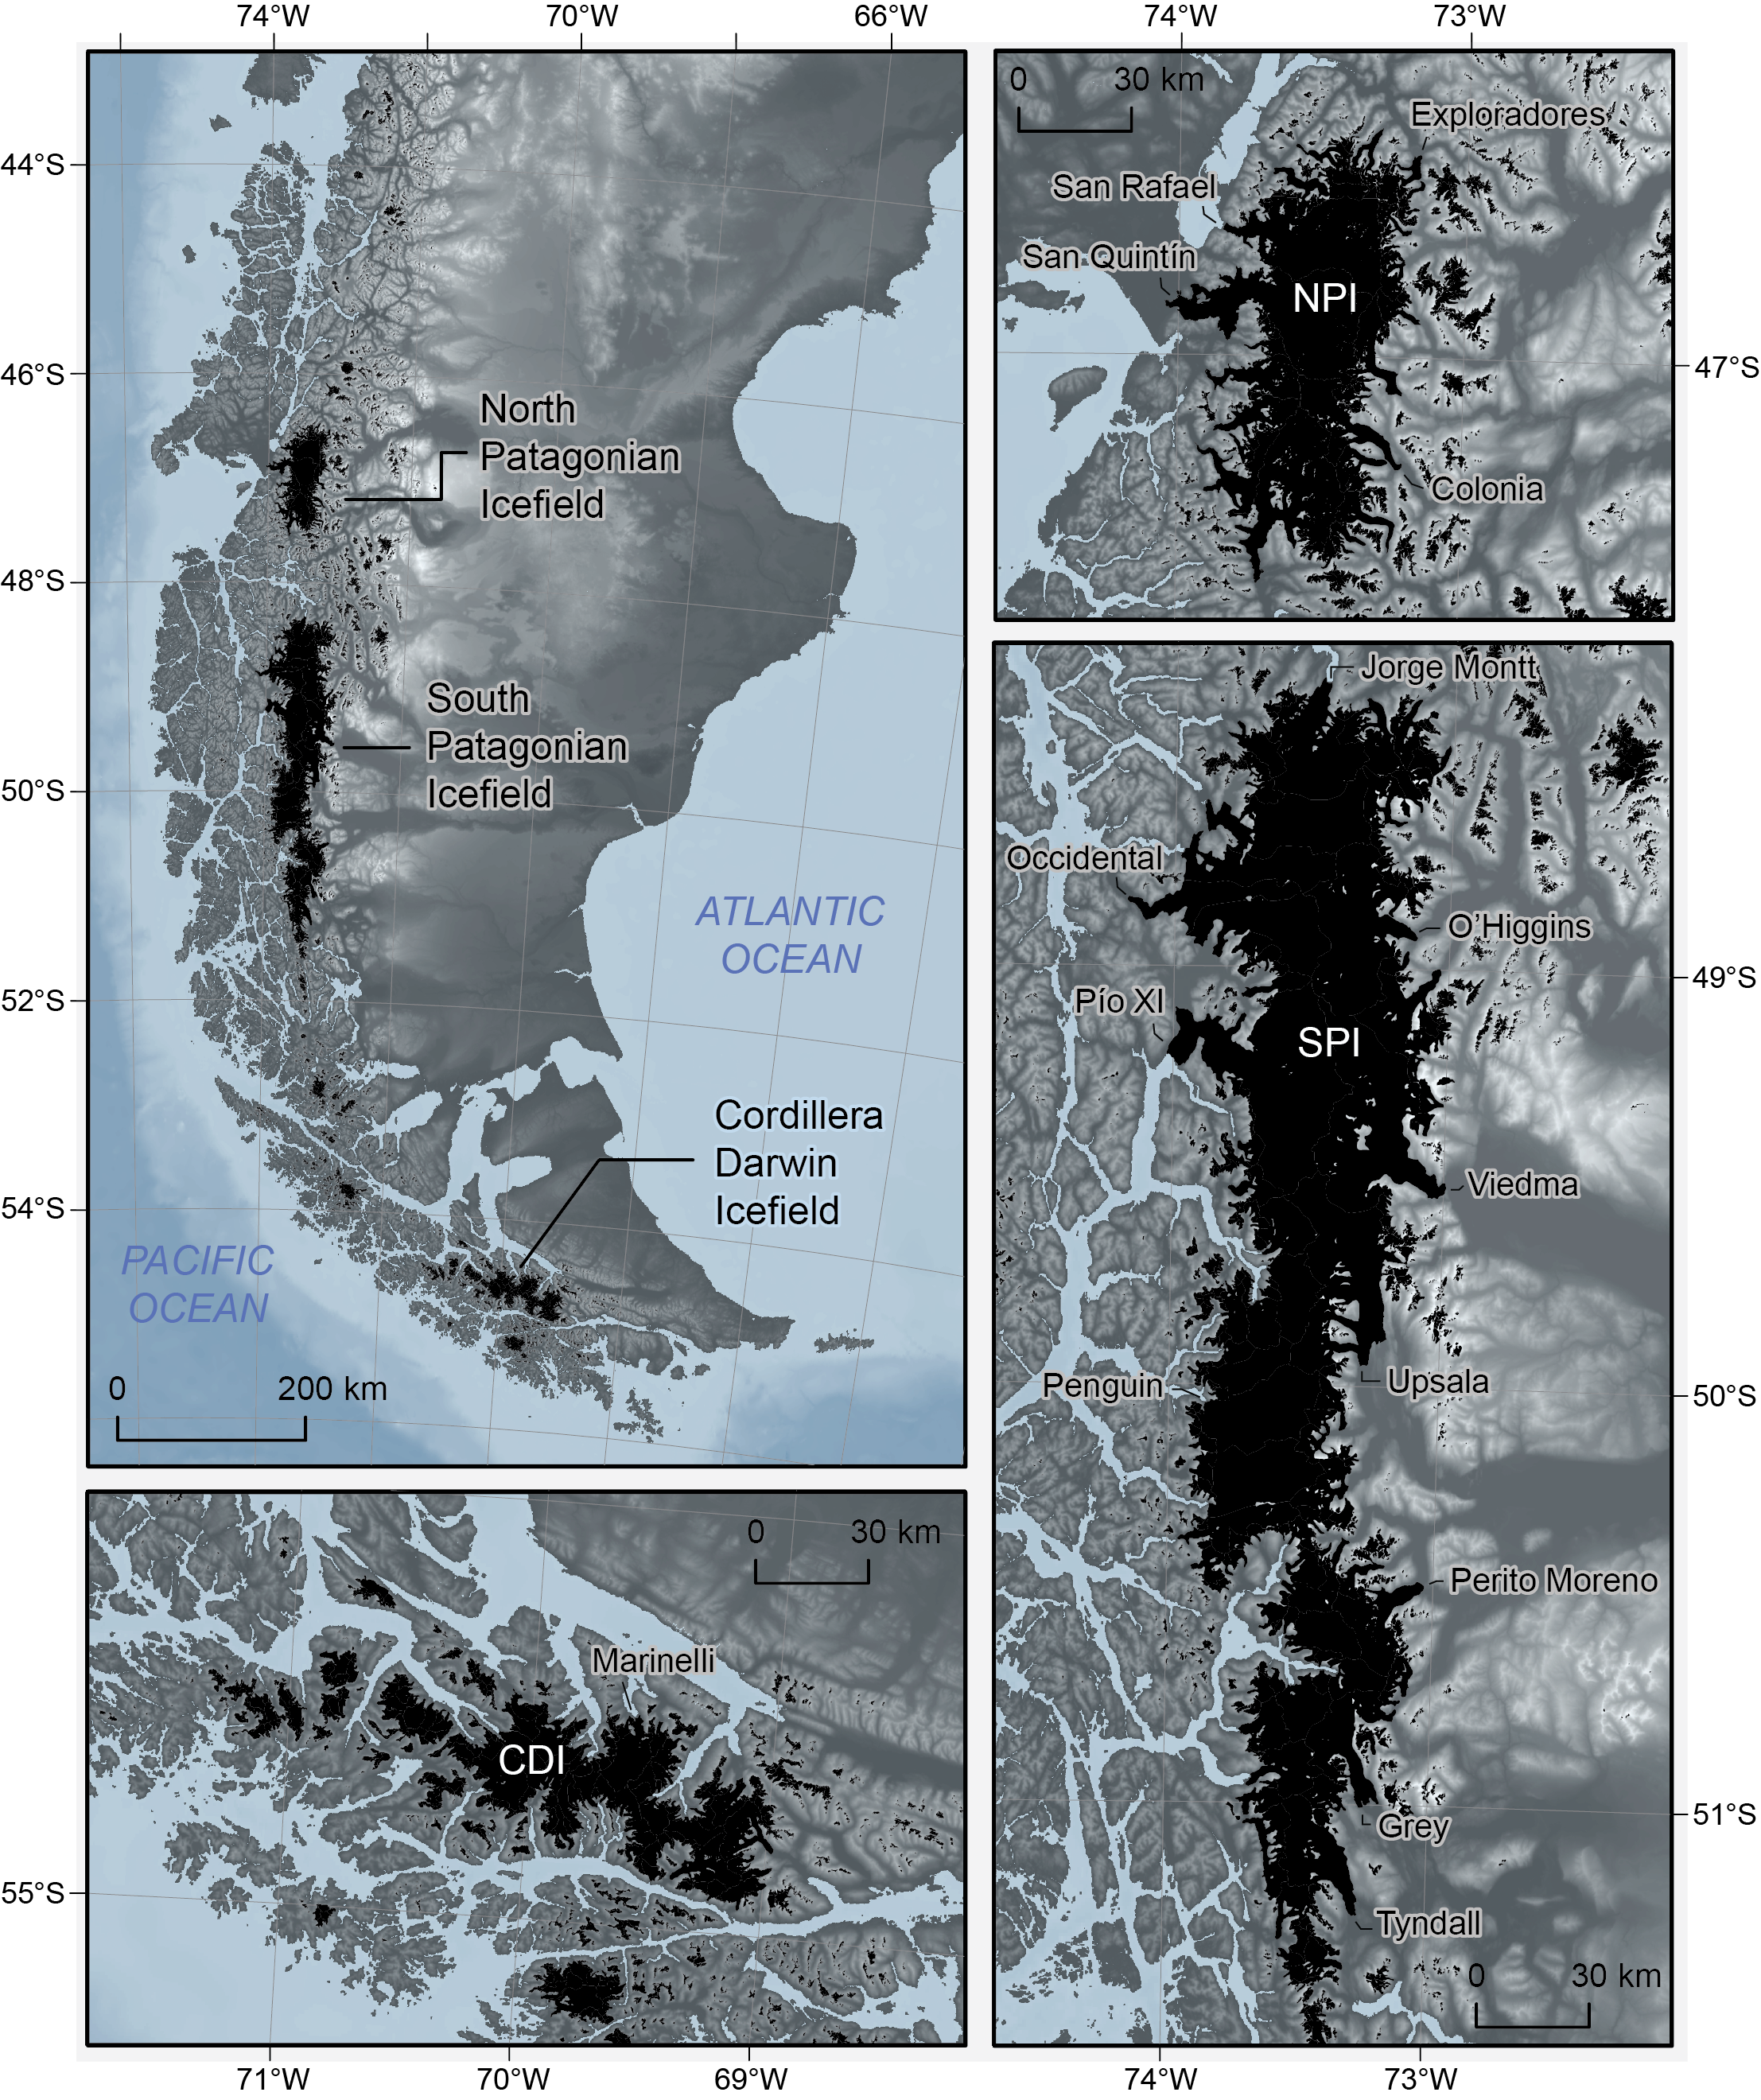
While the Patagonian Andes are home to hundreds of small caps and valley glaciers(5,6,7,8), most ice is locked up in three large icefields, called the North, South, and Cordillera Darwin Icefields (see map below). Together, these icefields contain around 5,500 gigatons of ice, enough to raise global sea level by around 15 mm if completely melted(9).
The three major Patagonian Icefields, which occur south of ~46°S, are the largest expanse of ice in the Southern Hemisphere outside Antarctica(10). While large, today’s icefields are the remnants of a much larger Patagonian Ice Sheet, which formed during the global LGM around 21,000 years ago.
Dynamic outlet glaciers
Outlet glaciers of the Patagonian Icefields are fed by heavy snowfall (up to 10,000 mm per year) in the accumulation area, and have high melt rates at lower elevations. As a result, they have high mass balance gradients and are very dynamic(10), especially on the western coast snowfall is highest(11).

_-_(25185427415).jpg)
North Patagonian Icefield
Size, elevation, and structure
The North Patagonian Icefield (NPI) stretches over 100 km from 46°30’S to 47°30’S (see map above). Its current size is estimated at ~3,700 km2(8,12).
The NPI is drained by 29 main outlet glaciers (>10 km2), with glacial tongues that terminate in different settings(7). 11 (38%) outlet glaciers terminate on land, 17 (59%) terminate in lakes (e.g. Glacier Exploradores), and only one (3%), Glacier San Rafael, terminates in the sea.
The average elevation of NPI glaciers is around 400 m lower on the western side of the icefield (1240 m asl) than on the east (1640 m asl), reflecting the higher rates of snowfall in the west(8).

Glacier Flow speeds
The fastest-flowing glacier of the NPI is Glacier San Rafael (NASA Fig). This glacier is flowing at 7.6 km per year (around 20 metres per day11). In total, three NPI glaciers flow faster than 1 km per year (San Rafael, San Quintín, and Colonia11).

South Patagonian Icefield
Size, elevation, and structure
The South Patagonian Icefield (SPI) is the largest of the South American icefields. It stretches over 350 km from 48°20’S to 51°30’S, and its current size is estimated at ~12,200 km2 (around three times larger than the NPI8).
The SPI is drained by 53 main outlet glaciers (>10 km2) that are generally larger than those of the NPI. The SPI has a similar amount of lake-terminating glaciers (59%), but more (17 or 32%) marine-terminating glaciers(7).

Glacier Flow speeds
The SPI also has some of the fastest flowing glaciers in the world (see glacier flow speed diagram above). Of the ten fastest SPI outlet glaciers, which all move faster than 2.5 km per year, eight flow out into Pacific Ocean fjords (e.g. the Jorge Montt glacier shown below) and two into large glacial lakes (e.g. Glacier Upsala). The fastest, Glacier Penguin, flows at 10.3 km per year (around 28 metres per day11). These data suggest that ocean heat plays an important role in melting at glacier fronts, and rapidly drawing down ice from the SPI interior.


Cordillera Darwin Icefield
Size, elevation, and structure
The Cordillera Darwin Icefield (CDI) is the smallest (~2600 km2), and southernmost of Patagonia’s icefields(13), existing between 54°40’S to 55°00’S. It is also the least studied. Most CDI glaciers descend to sea level, and many flow into the Pacific Ocean(8).
Glacier Flow speeds
Most CDI outlet glaciers have flow speeds of between 1 and 3 metres per day(13). However, the marine-terminating Marinelli Glacier (the largest and fastest moving of the CDI glaciers) and Darwin Glacier, flow much faster, at around 8-10 metres per day(13).

Glacier change
Most glaciers of the Patagonian Icefields are experiencing negative mass balance, as a result of glacier thinning and the widespread retreat of ice-fronts(5,11,14). Only Glacier Pío XI (the largest glacier in South America) from the South Patagonian Icefield has grown in recent years(15,16). The overall pattern of ice loss make the Patagonian Icefields one of the largest current sources of global sea level rise (they contribute ~10% of that from all glaciers and ice caps worldwide17,18).
Since the Little Ice Age
Since the end of the Little Ice Age at around 1870 AD, over 90% of Patagonian outlet glaciers have shrunk(5,8,19) (see GIF below). Reconstructions of Little Ice Age glacier extents(19) show that the North Patagonian Icefield has lost around 103 ± 20.7 km3 of ice, and the South Patagonian Icefield around 503 ± 101.1 km3. This gradual melting of the icefields has contributed around 0.0018 mm to global seal level rise per year (or 0.27 mm in total) since 1870 AD(19).

Over the 21st century
During the last 40-50 years, however, the rate of Patagonian ice loss has sped up substantially. Between 1975 and 2000, the North and South Patagonian Icefields have lost a combined 15.0 ± 0.7 gigatons of ice per year(17). Between 2000 and 2011, the rate of ice loss increased further to 24.4 ± 1.4 gigatons per year(20,21), and has since remained similar (between 2011 and 2017 the icefields lost 21.29 ± 1.98 gigatons per year16).

Contribution to rising sea level
The current contribution of the Patagonian Icefields to global sea level rise is around 0.067 ± 0.004 mm per year(21), over one order of magnitude greater than the long-term contribution since the Little Ice Age(19). The rate of glacier melting is expected to continue, and maybe even increase, in coming decades(22).
Causes of icefield retreat: a warming atmosphere
The rapid melting of the Patagonian Icefields during the 21st century has several possible causes. For example, a warming atmosphere has resulted in a greater number of warm ‘summer’ days each year, and more melting at the glacier surface(23). At 50°S, for example, a warming of 0.5°C between 1960 to 1999 has resulted in a 0.5 m water equivalent increase in annual glacier melt in the ablation area(24).
Less snowfall, more rainfall
The amount of snowfall falling over the Patagonian Icefields decreased by around 5% between 1960 and 1999, whereas the amount of rainfall increased, both as a result of warmer air temperatures(24). Alongside faster surface melting, therefore, the amount of annual accumulation is getting smaller, preventing glacier growth.
Continued warming in Patagonia, therefore, will have a major impact on glacier accumulation and ablation trends(25), and will ultimately dictate the fate of the Patagonian Icefields.