What’s the difference between precision and accuracy?
In the sciences, it is important to distinguish between precision and accuracy. If we use the analogue of a clock we can investigate this further. Your wrist watch may measure time with a precision of one second. A stop watch may time your race with a precision of one hundredth of a second. However, if the clocks change and you forget to reset your wrist watch, then you have a very precise time but it is not very accurate – you will be an hour early or late for all of your meetings!
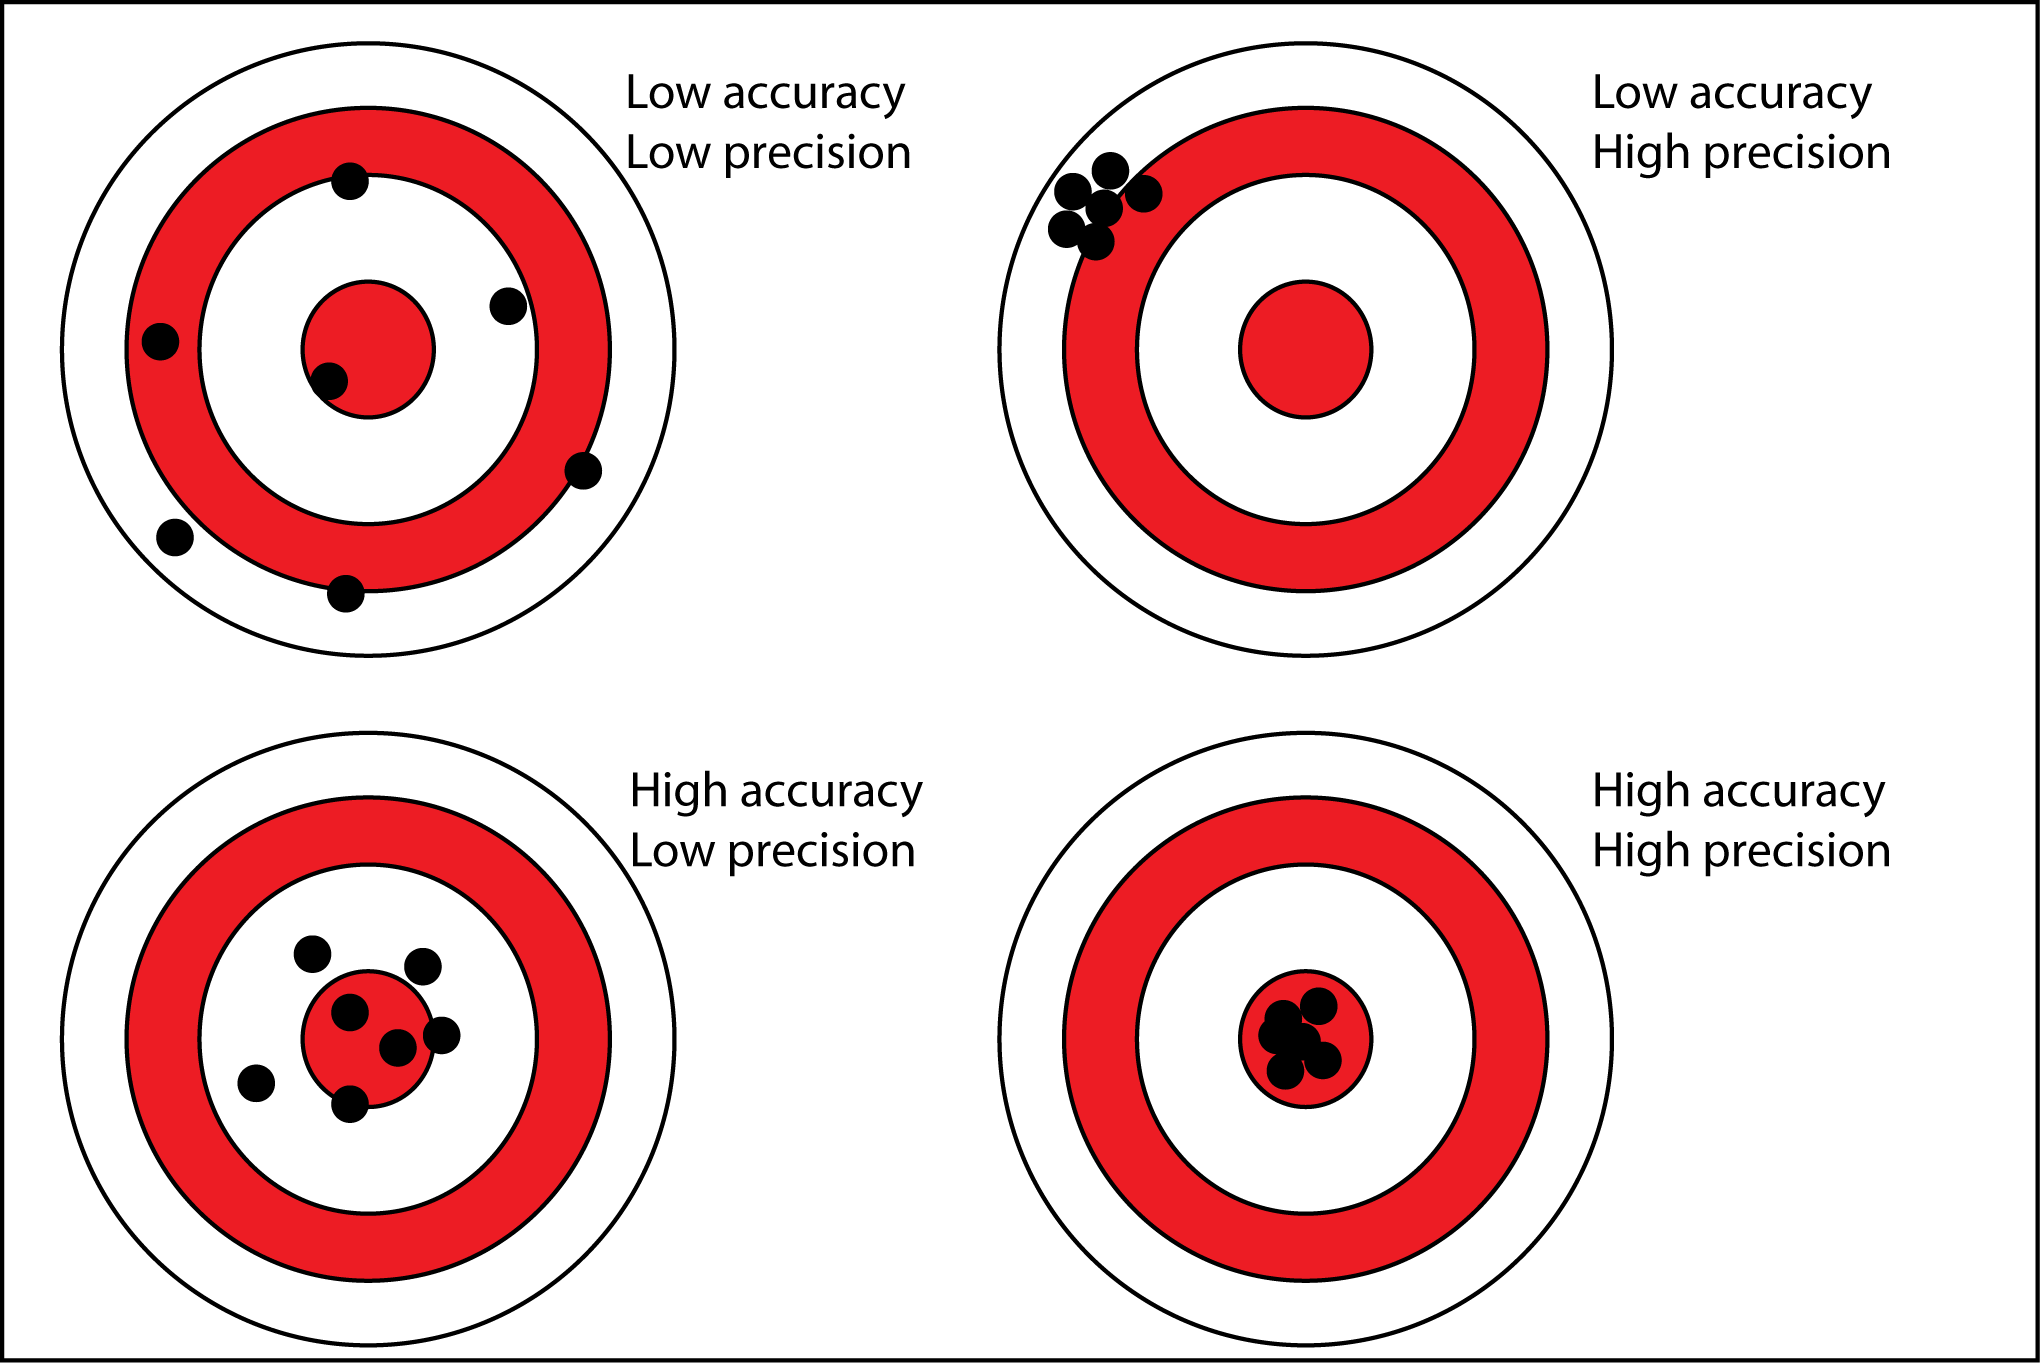
See the difference between accurate and precise measurements in the bull’s eye figure below. Scientists want measurements that are both accurate and precise… but it can be difficult to tell sometimes whether very precise measurements are actually accurate without an independent reference age (see top right image versus bottom right image).
This is a problem we regularly encounter in chronostratigraphy. Analytical techniques are very advanced and precise, but they may be inaccurate. Geological data frequently has difficulties in dating things, even if the analytical techniques can give very precise answers.
In the figure below, the precision is the laboratory probability density curve produced when a material is dated. The precision is effectively the laboratory uncertainty. The accuracy is how far this probability density curve falls from a reference value.

Cosmogenic nuclide dating

The precise measurements of cosmogenic beryillium-10 (10Be) atoms in a boulder yield measurements of an exposure age with very low uncertainties. But is it accurate? This analytical uncertainty does not take into account geological uncertainties – has your boulder rolled over, or has it been reworked and does it contain 10Be from a previous exposure? These factors may result in you having an exposure age that is both precise and inaccurate. In fact, in cosmogenic nuclide dating, the greatest uncertainties come from geological problems that result in inaccurate ages. This usually results in ‘geological scatter’, where boulders on one landform give a range of exposure ages.
The danger of inheritance (previously accumulated cosmogenic isotopes in a boulder) means that some scientists argue that, in the case of geological scatter, the youngest age is likely to be most accurate. However, if your moraine was unstable (perhaps it was ice cored?), then many of your boulders may have rolled or been covered with snow. So perhaps the oldest age is most accurate. It is the job of the scientist to sample carefully to minimise these potential sources of inaccuracies in cosmogenic nuclide dating.
Radiocarbon dating
Radiocarbon dating relies on the regular radioactive decay of carbon-14 in organic matter. Analytical techniques are now very advanced, and can give very small uncertainties on a radiocarbon age. But this isn’t the full story: like cosmogenic nuclide dating, there are plenty of sources of inaccuracies before the sample even gets to the laboratory.
One source of inaccuracies in radiocarbon dating is contamination. If your sample becomes contaminated with younger, modern material during the sampling process, then it will be invalid. Likewise, sampling strategy is important. If you sample sediments from the bottom of a lake that has a lot of incoming waters that have ancient radiocarbon in then, then you will derive an anomalously old age. Around Antarctica, the ocean water has a radiocarbon age of around 1300 years, though this varies spatially and may have varied in time as well. Again, this can affect the accuracy of your results – but the precision remains high.
Optically stimulated luminescence

Scientists can use optically stimulated luminescence to date the burial of sand grains like quartz and feldspar. Optically stimulated luminescence relies on quartz grains being fully bleached by the sun between burial episodes – so if your glacial meltwater stream is very murky, your quartz may not have received the full blast of the sun’s energy and the signal may not be fully reset. It is therefore very important to sample landforms where partial bleaching is likely to be minimal.
Summary
So what can we learn from this? Measurements on ages are often reported very precisely, and ever-improving laboratory techniques mean that uncertainties are always decreasing. But it is important not to take these ages at face value, and to think critically about whether or not they may be accurate. Scientists must understand the sources of error in their dating techniques before calculated ages can be reliably used.
What other sources of inaccuracies are there in Quaternary chronostratigraphy? Please contribute in the comments box below.
low-precision/low accuracy image is poor
actually has (relatively) good accuracy wrt others
You have to show separat Difference .
Like
Accuracy. |. Precision
1. 1
2. 2
3. 3
4. 4
Hi! I really liked the article. I was wondering whether I could use the image (of accuracy and precision) for educational purposes. Is it under any copyright rule?
Hi Maria,
the images have a creative commons attribution non-commercial licence. You can use the images as long as you attribute them correctly and if they are for educational purposes.
I made a subtly modified version of your accuracy vs. precision graphic, here:
https://sealevel.info/precision_accuracy02.png
I made the “low accuracy, low precision” example less accurate, and I made the “high accuracy, low precision” example a bit less precise.
I also added a visible attribution to the bottom, per your 2020-06-29 request, and I added a longer attribution as a metadata comment tag, which reads as follows:
“Source: https://www.antarcticglaciers.org/glacial-geology/dating-glacial-sediments-2/precision-and-accuracy-glacial-geology/ with slight modification by Dave Burton of sealevel.info. The image has a creative commons attribution non-commercial licence. You can use the image as long as you attribute it correctly (to antarcticglaciers.org) and as long as it is for educational purposes.”
I hope you don’t mind!
I came here for exactly this reason. The original image is the first image shown when googling “accuracy vs. precision”, but it’s highly misleading in my opinion, if not outright “inaccurate”.
I’ve adjusted your version even further. By their definition, high accuracy translates to “small error of the mean”, while high precision to “small variance”. Hence, I think both images on the left should have approximately the same variance, which is not the case in your version.
Here’s my version, do with it as you please: https://imgur.com/huEdiBJ