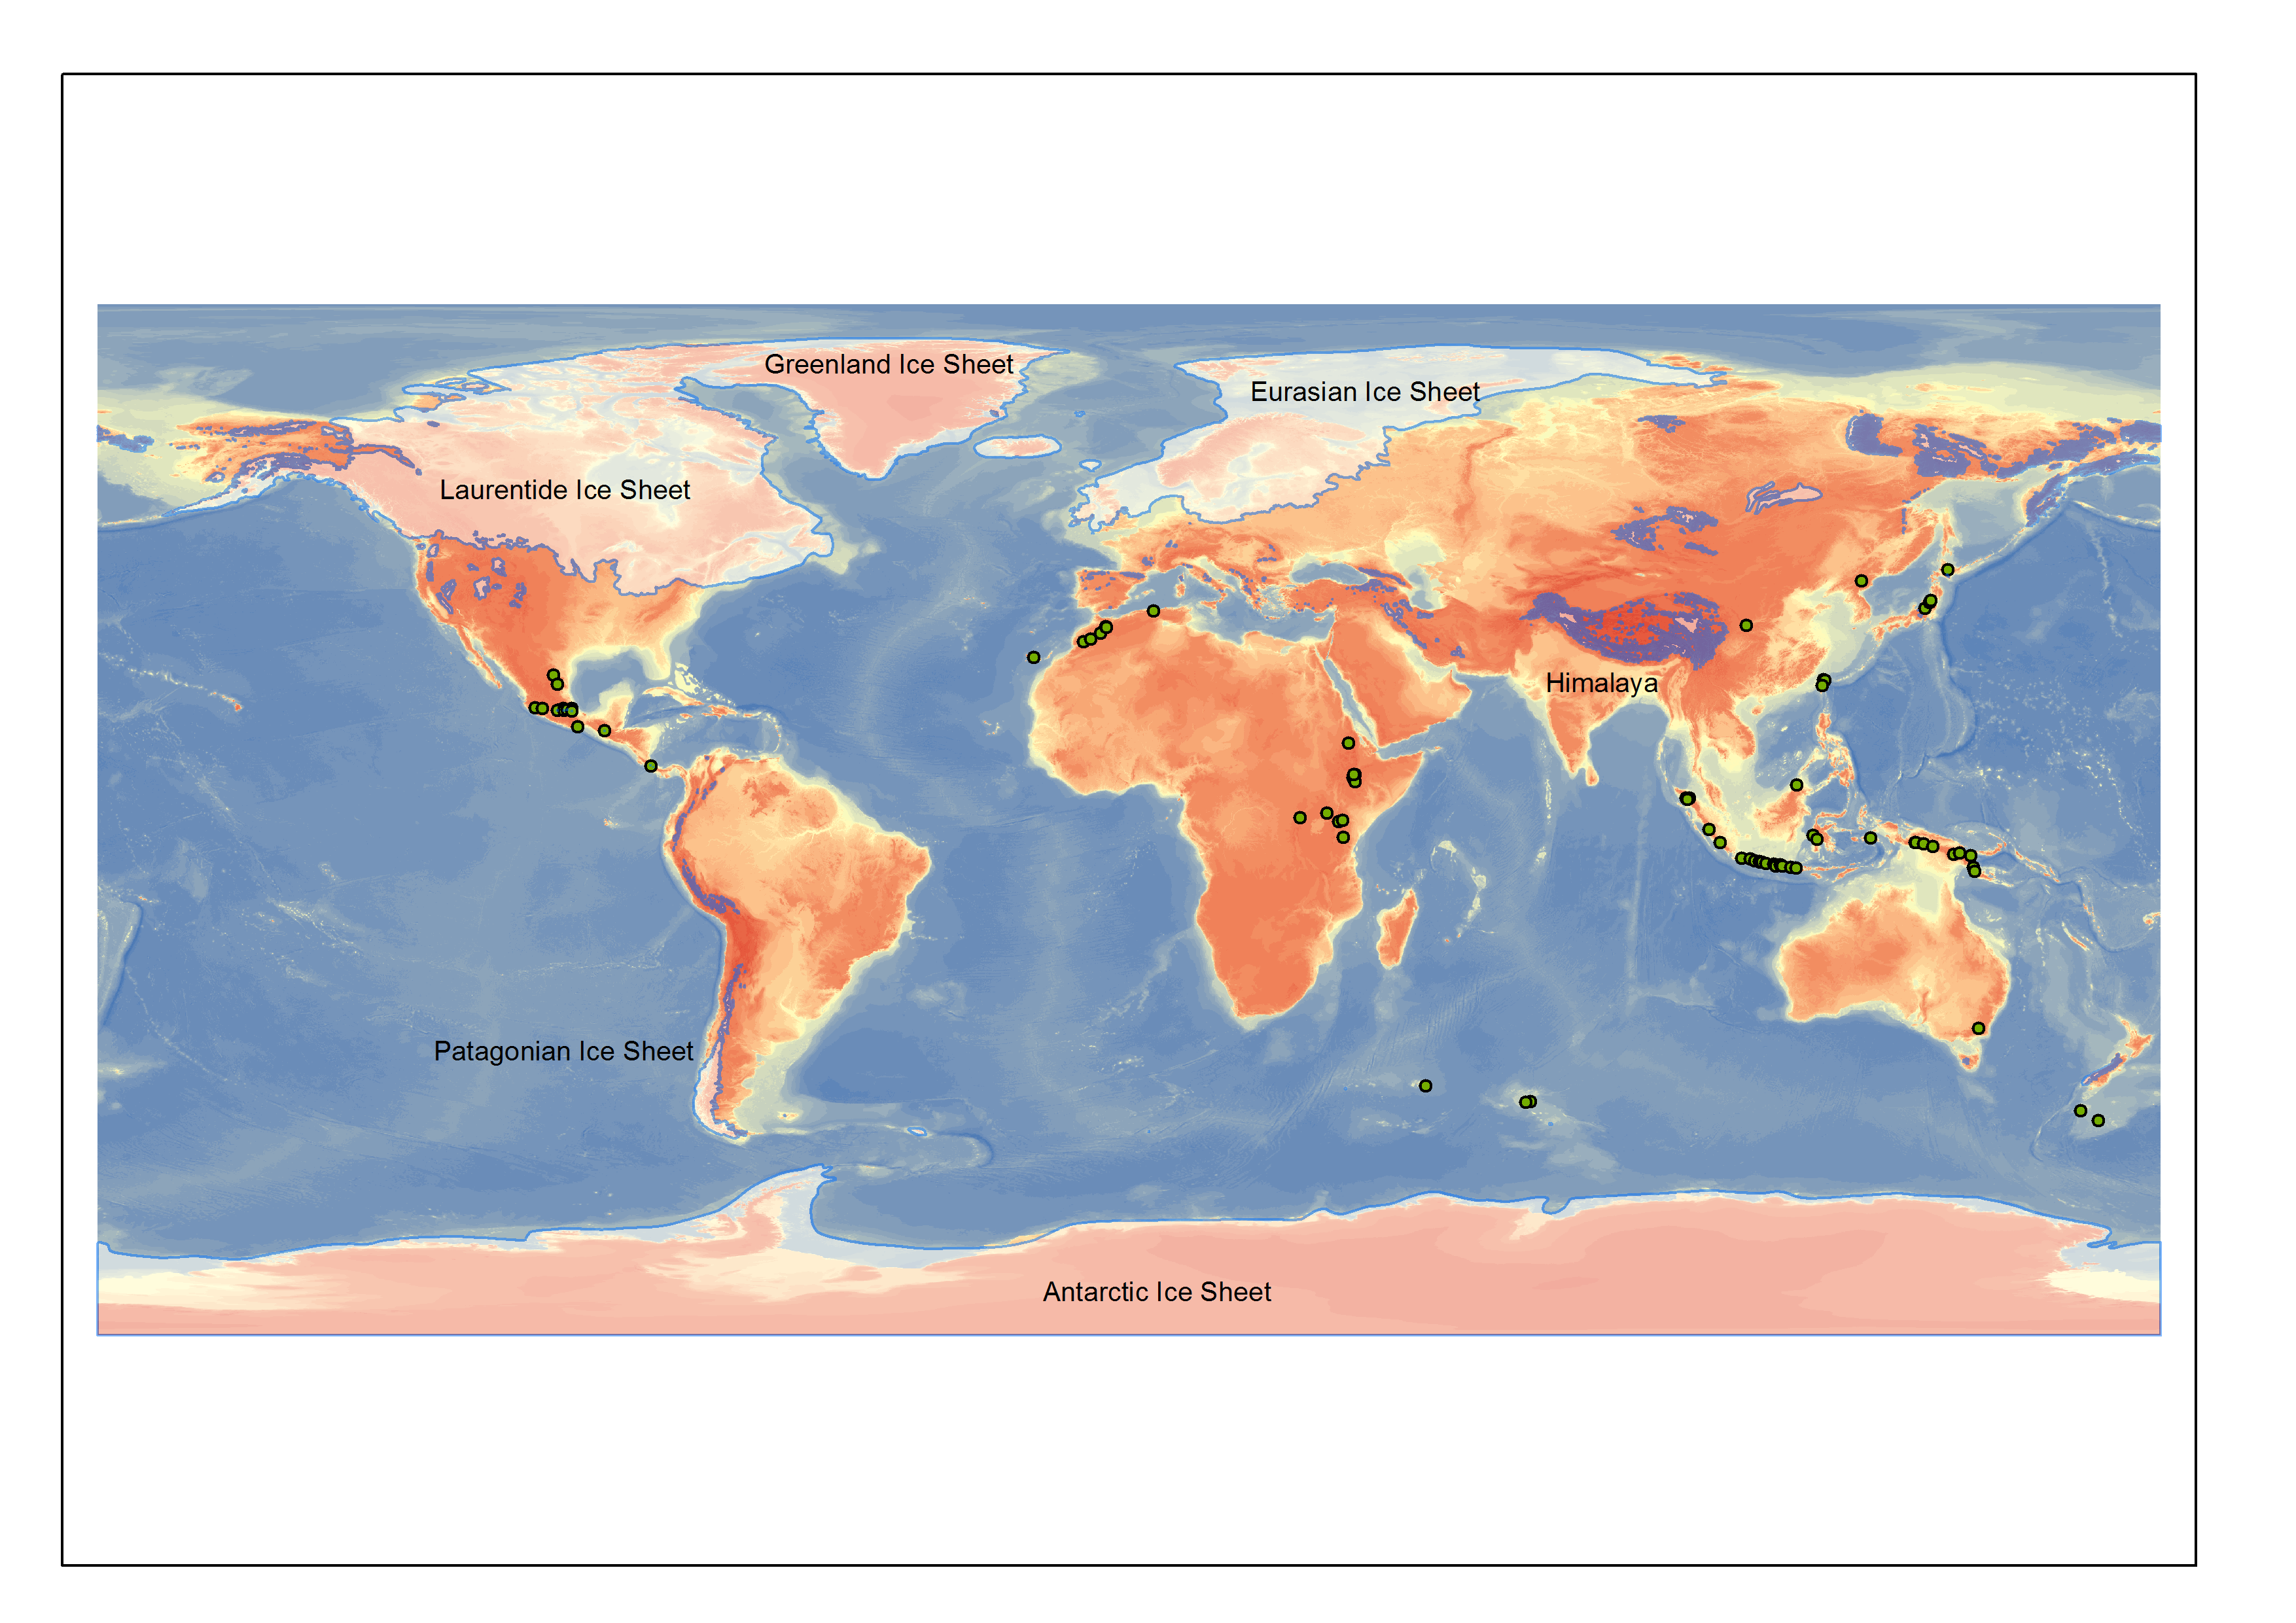
Around 27,000 years ago, ice sheets reached their maximum across the world, after a period of global cooling caused by variations in the Earth’s orbit around the sun. There was a massive ice sheet in North America (the Laurentide Ice Sheet)[1, 2], a large Eurasian Ice Sheet covering Britain, Ireland and Scandinavia as well as northern Europe[3], an ice sheet in Antarctica[4], the Himalaya and Patagonia[5, 6]. Land near the ice sheets that escaped glaciation was cold, with tundra vegetation. Northern Europe was frequented by ice-age animals such as mammoth, reindeer and arctic hare. There was a landbridge betweeb Britain and Europe, and animals could walk freely across it. Numerous human artefacts from this time are scattered across the landscape.
The term ‘Last Glacial Maximum’ (LGM) has no formal stratigraphic status in Geological time, however, because each ice sheet reached its maximum extent at different times[7]. The Global Last Glacial Maximum can also be defined by the global sea level low-stand; when all the ice was locked up in the ice sheets, global sea levels reached as much as 125 m below present. The timing of this, 26,000 to 21,000 years before present, could therefore delimit the timing of maximum ice volume worldwide [8]. The timing of the global Last Glacial Maximum could also be defined by the minimum in the marine isotope record. The status of the global ‘Last Glacial Maximum’ is therefore debated.
In Britain, the Last Glacial Maximum was reached around 27-21 ka[3], but different parts reached their maximums at different times. Like many ice sheets at their maximum, it was constrained at its northern limits by the steep drop in the sea floor at the continental shelf edge. Likewise in Patagonia, the ice sheet reached the continental shelf edge and could go no further on its Pacific, western margin[6]. In the Antarctic Peninsula, the Antarctic Ice Sheet reached the continental shelf edge at around 25,000 years ago[9].
A recent publication, Quaternary Glaciations – Extent and chronology, a closer look, edited by Ehlers, Gibbard and Hughes[10], provides detailed information on each of these ice sheets at their maxima. It even provides GIS shapefiles that you can download to examine the LGM of each ice sheet yourself:
http://booksite.elsevier.com/9780444534477/digital_maps.php
In the map above, you can see the extent of the world’s ice sheets outlined in blue. Mountain glaciers are shown as green dots. The continental shelf edges around the world are visible in paler blue, and in many places would have been dry land due to the global sea level lowering at the Last Glacial Maximum, but close to the ice it would depend on how much each individual landmass was lowered by the weight of the overlying ice sheets.
It would be interesting to know what was the level of CO2 at that time ? I bet it was much more than now ?
It was approximately 190 ppmv, thus much lower than now.
Is the fact that the heaviest ice is asymmetric about the current north pole evidence of a subsequent sliding of the earth ‘s crust over the core?
Why /how did the earth leave its usual orbit to create the global maximum in the first place? Any links or layperson references appreciated.
The Earth did not leave it’s usual orbit. There are natural long-term, large scale orbital cycles that affect major glaciation events. These are called Milankovitch cycles.
– https://climate.nasa.gov/news/2948/milankovitch-orbital-cycles-and-their-role-in-earths-climate/
And no, the asymmetry of ice build up is not due to any sort of crust “sliding over the core”, it’s simply a matter of the fact that ice can build up better over land than on water. Antarctica didn’t change much during the LGM because it’s isolated by a surrounding ring of ocean. The Northern Hemisphere has a lot of connected landmass, so the ice didn’t have the same sorts of limitations to its build-up.
I wanna know how much colder Indian Subcontinent was in contrast to 21st century during last glacial maximum?
Thanks for your question, it is really interesting.
In contrast to the higher latitudes in the Northern Hemisphere, it is thought that the Indian Subcontinent didn’t have a significant shift in temperature regimes, but instead with moisture availability. Studies have shown that most of India faced stronger monsoon seasons compared to the monsoon seasons in the 21st Century.
Where in the Earth tilt angle continuum are we now and where is it going?
What was the tilt angle at the last Glacial Minimum?
How close are we now to that angle and what is the rate of tilt angle change per 1000 years? Does the velocity of tilt angle change remain constant or does it show periods of acceleration or deceleration?
Thank you.
May i know how the position of continents at that time affected the climate during Last Glacial Maximum?
Hi Isha,
Good question. As the Last Glacial Maximum was only about 21,000 years ago, there hasn’t really been much change in the continents position compared to their locations today. Continental drift takes hundreds of millions of years.
However, what you did find was that the current position of the continents in the Northern hemisphere meant that there was a lot more Ice cover from the poles to about 65 degrees N as there was more land than water.
Hope this helps,
Laura
Could someone please tell me if there is any information about how much colder the climate was in Ireland during the Last Glacial Maximum?
Hi James, Have a look at our Irish Ice Sheet page, It should answer your question nicely!