Introduction | Remote sensing of glaciers | Glacier inventories | The Randolph Glacier Inventory | Glacier contributions to sea level rise | Summary | References | Comments |
Introduction
How many glaciers are there in the World? How much ice do they have? How much will they raise sea levels on full melting? How likely, and how quickly, will this happen? Glaciers and ice caps (excluding the large Antarctic and Greenland ice sheets) respond quickly to climate change, and are likely to dominate eustatic (freshwater input from melting ice) contributions to sea level rise over the next few decades. Despite their comparatively small area, glaciers contribute significantly to global sea level rise1. But field campaigns to the ice are difficult, and in situ measurements of ice extent are time consuming, expensive, and cannot possibly be applied to all the glaciers in the world.
Remote sensing of glaciers
Instead, we can use remote sensing of glaciers to estimate their size and volume. By mapping glaciers from satellite images, we can not only inventory the World’s glaciers, we can also analyse their rates of change and dynamic behaviour. The Landsat programme, for example, has provided four decades of Earth imaging, meaning that we can analyse glaciers from 1972 to the present day. The succession of Landsat satellites means that we can do repeated inventories, measuring glacier change at decadal scale resolution or better.

There is a trade-off between resolution and swath size (swath is the footprint / width of the satellite image, resolution is the pixel size). The multispectral scanner (MSS) of Landsat 7 and the Operational Land Imager (OLI) of Landsat 8, the most recently launched satellite, is 30 m. This means that you can only pick out individual features larger than this, but it’s ideal for analysing glacier size, glacier characteristics, and for mapping glacier change2.
The table below lists some of the characteristics of each of the successive Landsat satellites, with their Launch and End of Service dates.
| Satellite | Launch | End of service | Resolution (m) | Instruments | Altitude (km) | Swath (km) | Repeat interval |
| Landsat 1 | 23/7/72 | 6/1/78 | 80 | RBVMSS | 917 | 185 | 18 days |
| Landsat 2 | 22/1/75 | 25/2/82 | 80 | RBVMSS | 917 | 185 | 18 days |
| Landsat 3 | 5/3/78 | 31/3/83 | 4080 | RBVMSS | 917 | 185 | 18 days |
| Landsat 4 | 16/7/82 | Data failed 08/93 | 8030 | MSSTM | 705 | 185 | 16 days |
| Landsat 5 | 01/03/84 | No recording capability | 8030 | MSSTM | 705 | 185 | 16 days |
| Landsat 6 | 05/10/93 | 05/10/93. Failed to reach orbit. | 15 (pan)30 (MS) | ETM | 705 | 185 | 16 days |
| Landsat 7 | 4/99 | SLC failed 31/03/03 | 15 (pan)30 (ms) | ETM+ | 705 | 185 | 16 days |
| Landsat 8 | 11/02/13 | Operational | 15 (pan)30 (ms) | OLITIRS | 705 | 185 | 8 days |
RBV = three-camera return-beam vidicon; MSS = Multispectral Scanner; TM = Thematic Mapper; OLI = Operational Land Imager; TIRS = Thermal Infared Sensor; SLC = Scanning line corrector
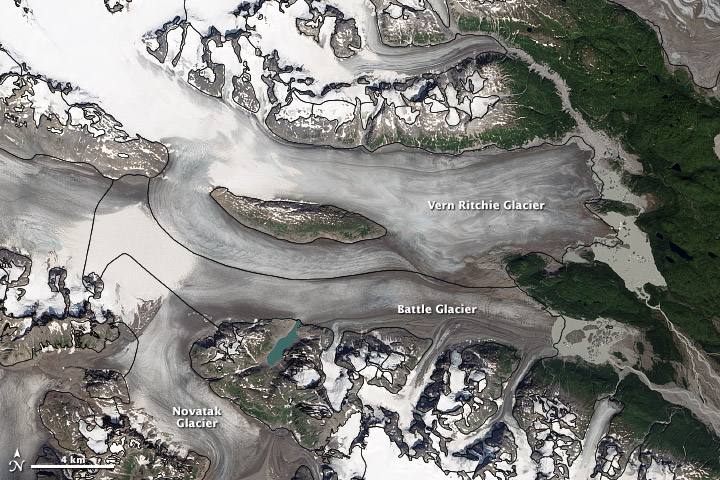
Case Study: Columbia Glacier, Alaska
Columbia Glacier is Alaska ‘s fastest-moving glacier. It flows through the Chugach Mountains to Prince William Sound.
From 1980 onwards, the glacier has been fast receding. Landsat images of the glacier from 1986 to 2019 show its rapid recession. It is one of the most rapidly changing glaciers in the world.
The figure below, from NASA, shows the glacier extent in 1986. You can see the glacier terminus, right out in the mouth of the fjord. Medial Moraines form where two trunks of the glacier merge.

The glacier remained near the mouth of Columbia Bay until 1980, when it began to rapidly recede. This is continuing today. Since the 1980s, it has receded more than 20 km to the north, retreating by up to 1 km per year.
The GIF below is a series of Landsat images from 1986 to 2019. You can see the terminus receding north up the bay. The bright white blocks in the sea are icebergs that have calved from the terminus.

For more information, visit the NASA Earth Observatory pages.
Glacier inventories
Glacier inventories are a specific technique for mapping glacier extent, volume and characteristics. The Global Land Ice Measurements from Space (GLIMS) programme defines guidelines and rules for conducting glacier inventories3-10. It ensures that inventories carried out in different places by different people are comparable. GLIMS also compile all the mapped glacier outlines as ESRI shapefiles, which are freely downloadable by anyone from their website. This means that we can conduct large meta-analyses of the entire dataset.
The inventories should include glacier attributes, such as area, length, slope, aspect, terminal environment (calving into the sea or lake, or terminating on dry land), elevation, and glacier classification. Landsat images can also be used to map transient snow lines, the snowline at the end of the summer, which can be a proxy for the equilibrium line altitude11. These data provide baseline information for an assessment of glacier changes.
The Randolph Glacier Inventory
Following years of diligent glacier mapping, the Randolph Glacier Inventory (RGI) is a globally complete collection of digital outlines of glaciers, excluding ice sheets12. Most of the outlines are from analyses of satellite imagery dating from 1999-2010.

Number of glaciers
From the RGI, we can learn that there are 198,000 glaciers in the World. However, this is a slightly arbitrary quantity, as it depends on the quality of the digital elevation model used, mapping resolution, and the minimum-area threshold used. Most analysts use a minimum area threshold of 0.1 km2; they will not map anything smaller than this due to difficulties in distinguishing between glaciers and snowpacks. If these small glacierets are including, the number of glaciers in the World could be up to 400,000, but they would still only account for 1.4% of the World’s glacierised area.
Together, these glaciers cover 726,000 km2. The region with the most ice is the Antarctic and Subantarctic, with 132,900 km2, closely followed by Arctic Canada North (104,900 km2). At the other end of the scale, New Zealand has only 1160 km2 of ice. In total, 44% of the World’s glacierised area is in the Arctic regions, and 18% is in the Antarctic and Subantarctic. Glaciers cover 0.5% of the Earth’s land surface13.

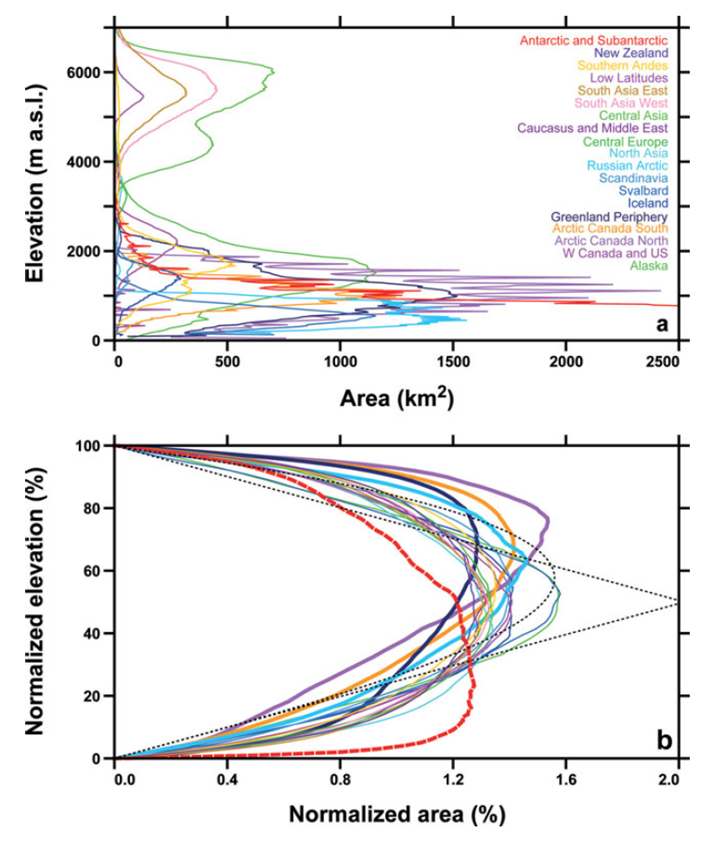
Glacier elevations
Most of the World’s glaciers lie below 2000 m above sea level, and in most regions, most of the glacierised area is in the mid-elevation ranges. The distribution of area with elevation is skewed in the Antarctic; the low-lying tidewater glaciers mean that the Antarctic has a large amount of low-lying ice. In contrast, Arctic Canada North is skewed towards higher elevations, due to the preponderance of ice caps on high-elevation plateaus. The distribution of glacier area with altitude is important, as it means that different areas will respond to climate change in different ways.
Glacier volume
Estimates of global glacier volume use various methods of volume-area scaling. Radić et al., 2014, use the RGI to estimate global glacier volume at 405 mm sea-level equivalent (SLE) (146,949 Gt or 163,276 km3 ice)14. Grinstead, 2013, used a different approach to reach a lower estimate of 350 ±70 mm SLE15. The estimate of glacier volume depends strongly on the method used, and more data are urgently required to improve the uncertainties on this estimate.
Glacier contributions to sea level rise
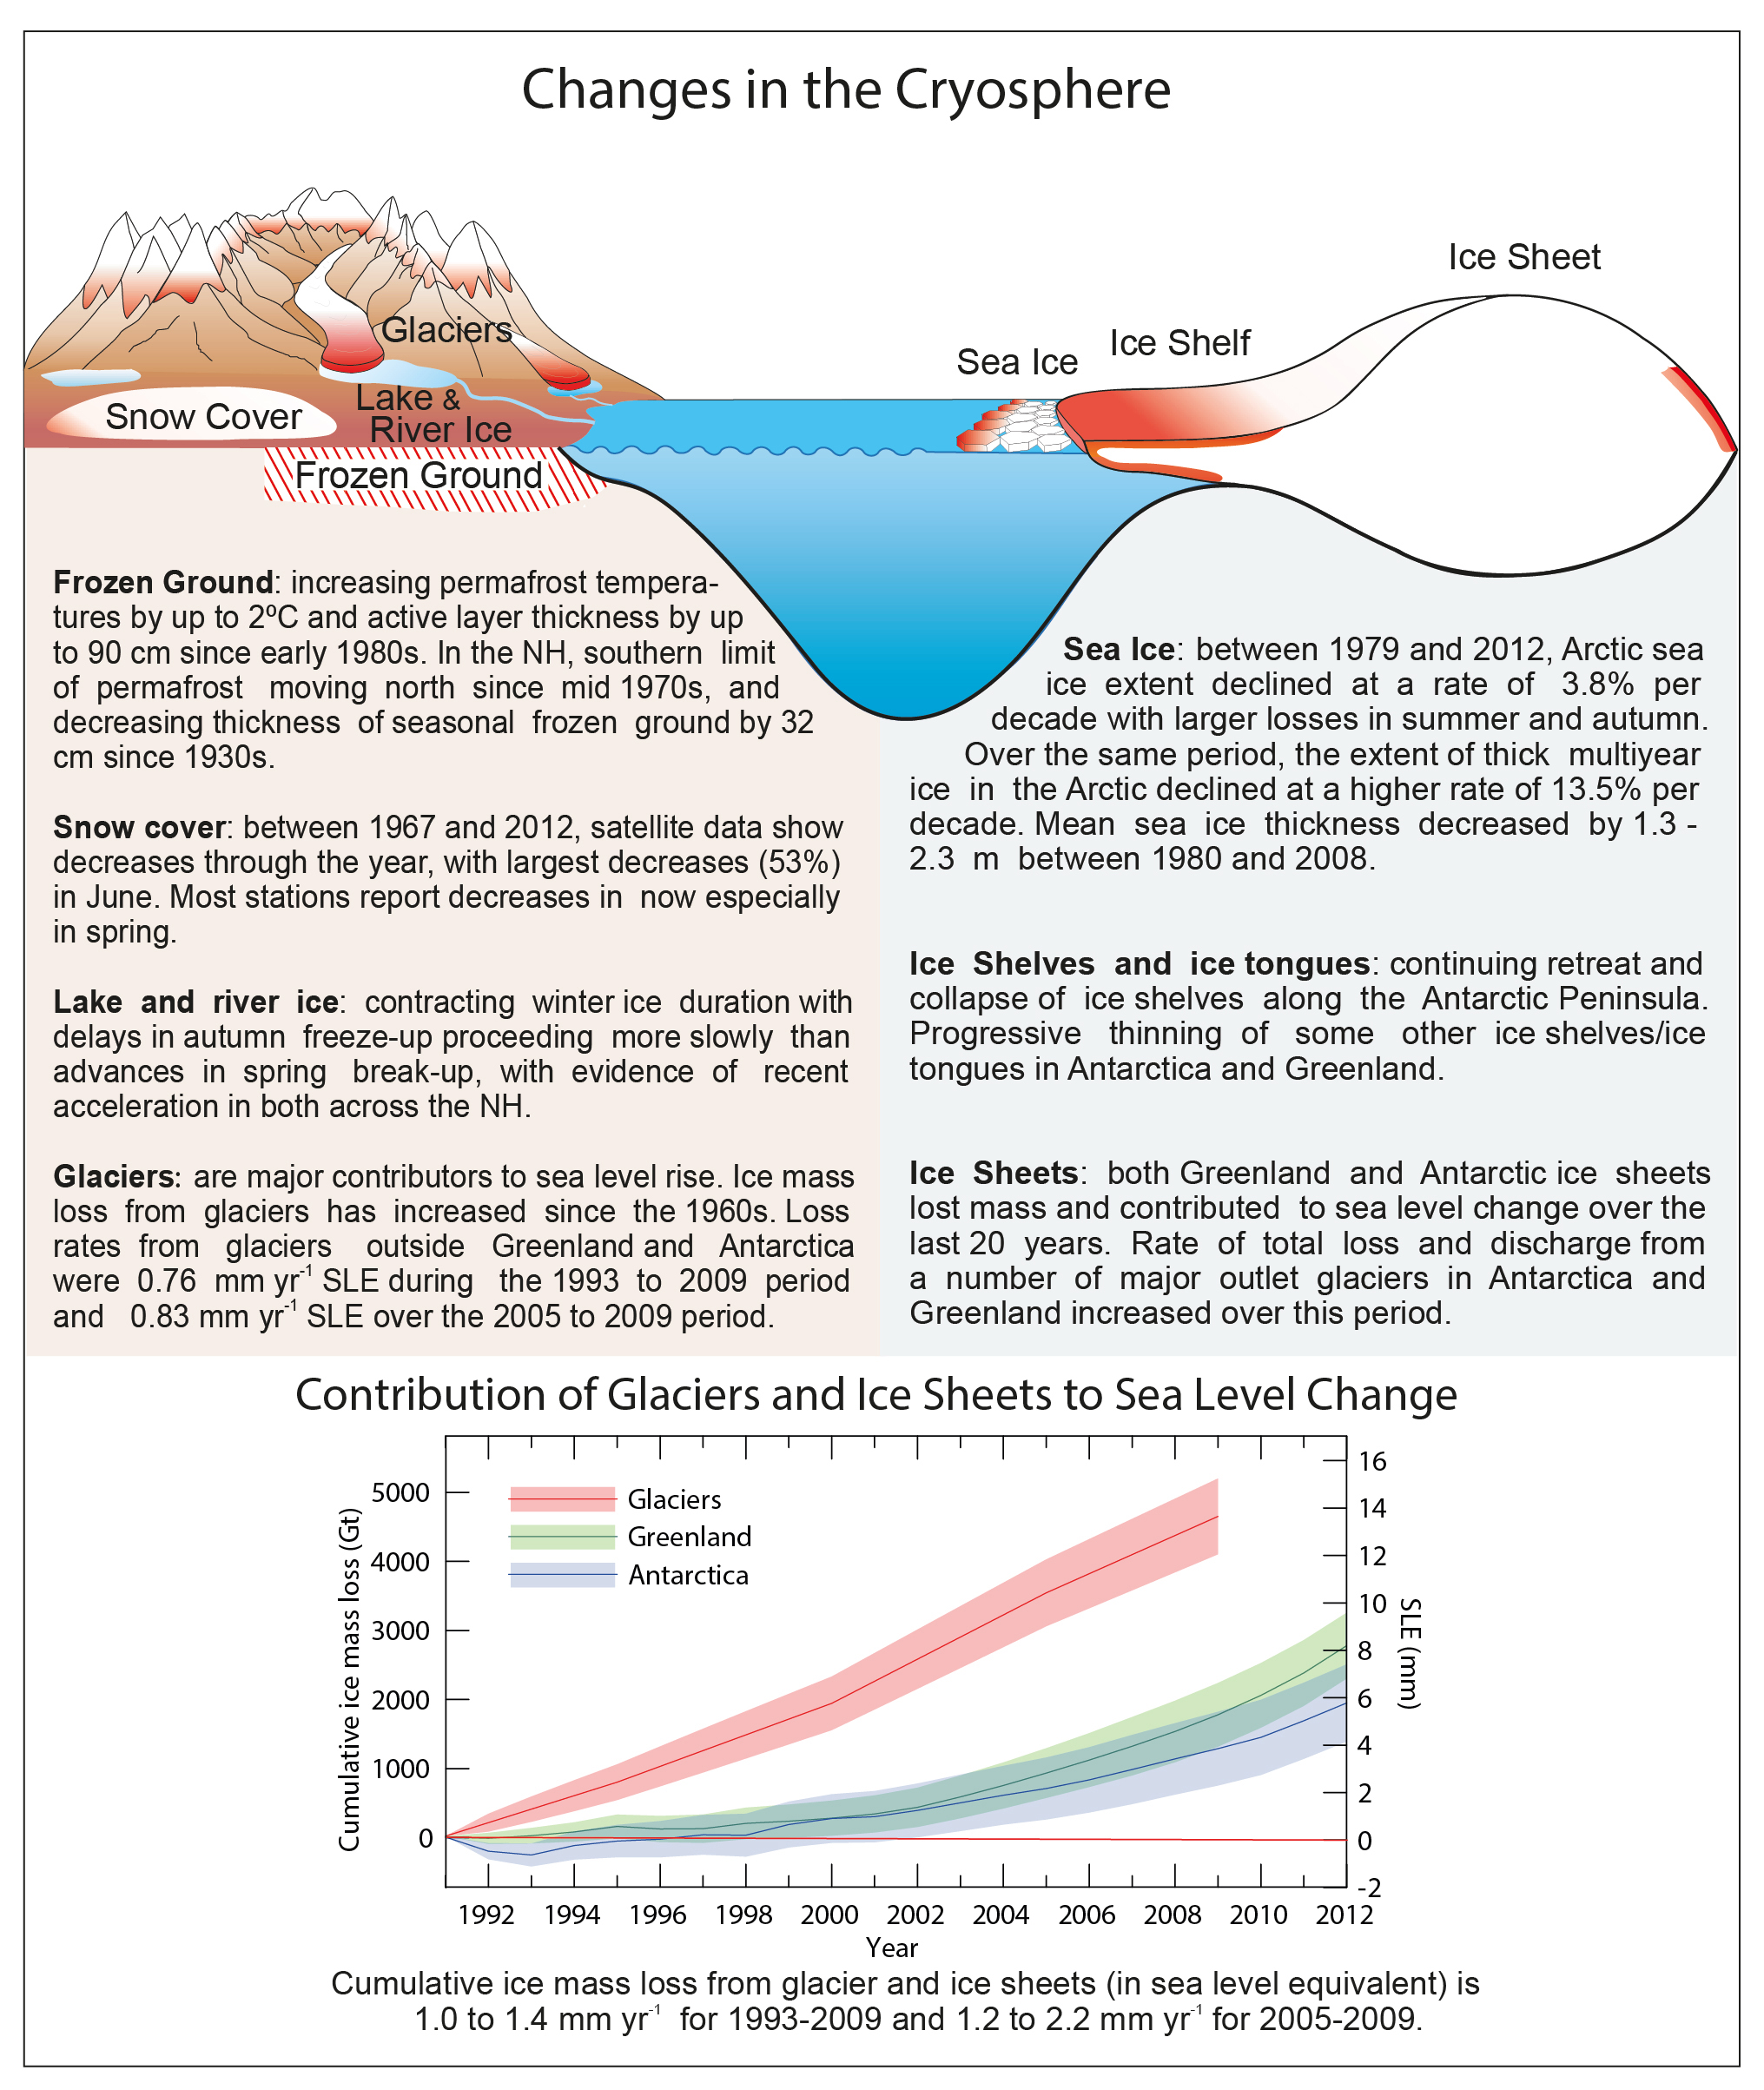
Now that we have a complete dataset on global glacier outlines, we can use these data to understand glacier mass balance and potential contributions to sea level rise. Gardner et al., 2013, used the RGI and satellite gravimetry and altimetry to provide an estimate of the mass balance of the World’s glaciers from 2003-200916. They found that all regions of the world were losing mass, with the largest losses from Arctic Canada North, Alaska, coastal Greenland, the southern Andes and high-mountain Asia. Glaciers in Antarctica are currently contributing little to global sea level rise. From 2003-2009, the global glacier mass budget was -259 ± 28 gigatonnes per year, which is equivalent to the combined ice loss from Antarctica and Greenland. Ice loss from glaciers contributes 29 ± 13 % of observed sea level rise. However, more data on global rates of glacier change are needed to improve these estimates of global glacier mass balance.
Radic et al., 2014, indicate that, under the IPCC scenario RCP4.5 (CO2 falls after AD 2050), global sea-level contributions from glaciers will be 155 ± 41 mm by 2100 AD. Under IPCC scenario RCP 8.5 (a more business-as-usual scenario), global sea level contributions from glaciers will be 216 ± 44 mm by 2100 AD14. In context, that means that by 2100 AD, about half of all the World’s glaciers will be gone unless strong mitigation strategies are employed. That would have devastating consequences for the millions of people who rely on glaciers to provide freshwater, as they buffer the effects of a seasonal precipitation regime, and would dramatically increase glacier hazards associated with glacier recession. Tourism and economies would be hit as Alpine glaciers shrank, and sea level rise would require costly mitigation strategies.
Although currently glaciers make a large contribution to global sea level rise, their total contributions are eventually limited by their relatively small area. Over thousands of years, the Antarctic and Greenland ice sheets are likely to be much more important. Levermann et al., 2013, argue that, over thousands of years, the Antarctic ice sheets will contribute 1.2 m of sea level rise per degree of warming. For warming between 2-4°C, the Greenland Ice Sheet will contribute 0.34 m of sea level rise per degree of warming, and it has a total sea level contribution of up to 6 m17. However, the sea-level equivalent of all the glaciers in the world is only 405 mm, which means that eventually glaciers’ contributions are fairly small when compared with thermal expansion of the ocean.

Summary
There are about 198,000 glaciers in the world, covering 726,000 km2, and if they all melted they would raise sea levels by about 405 mm.
Glaciers have short response times and therefore react quickly to climate change. They are currently contributing about one third of currently observed sea level rise, and are more important than the Antarctic and Greenland ice sheets on decadal timescales. The regions currently losing mass fastest are Arctic Canada North, Alaska, and glaciers around the periphery of the Greenland Ice Sheet. However, their long-term contributions to global sea level rise are eventually limited by the relatively small volume of ice contained in the World’s glaciers.
Hi–we stopped in to look at your article on Glaciers as a part of our study of weather and the water cycle in science. Thanks for such a great post and photos.
HOW MANY PERCENT OF WORLD GLACIERS MELTED SINCE 1900 PLS !!
a lot
“Global warming” and “climate change,” when spoken by members of the mainstream media and politicians, is an absolute disgrace and manipulation to justify theft of the American taxpayer. Is it important for everyone to do their part to respect the planet- YES! Absolutely! Is the federal government to be trusted? NO! Absolutely not!
probably a lot probably
To do Plantation is a must and need to preserve greeneries which are evolving in the world and should prevent deforestation strictly by government especially global.
Madam,
Thanks for a very detailed and informative paper.
Would like to have your comments about the Glaciers in the Himalayas with regard to the parameters you mentioned. Thanks!
how many glaciers melt and freeze back every year perty please ?
Hi
Glaciers don’t melt and freeze back every year. Each year they have snow falling over them, and over time the snow is compressed and turns to ice. The glacier ice melts a little each year. The amount of snow and ice that has been gained and lost over the course of one year is the summed up. If there is more gained, then the glacier grows, if there is more lost, then the glacier shrinks.
Glaciers by definition don’t grow back and melt each year. Only snowpacks do this.
are glaciers landforms??
Thank you for your substantiate
Very interesting info, we Just navigated through the Chilean fjörds to appreciate many glaciers and also inland where you can find glaciers in lakes. Absolute fantastic landscape.
Thanks for such informative post on glaciers studies.
Thanks for such informative post on glaciers studies.