How much land ice is there in the World?
Most (99.5%) of the permanent ice volume in the world is locked up in ice sheets and glaciers. The Antarctic Ice Sheet is the largest store of frozen freshwater; it would raise sea levels by 57.9 m (its “sea level equivalent”, or SLE) on full melting (BedMachine). The Antarctic Ice Sheet covers 8.3% of the Earth’s land surface.
The Greenland Ice Sheet has a sea level equivalent ice volume of 7.42 m, and covers 1.2% of the global land surface (BedMachine).
Finally, glaciers and ice caps have a sea level equivalent ice volume of 0.32 m, covering just 0.5% of the global land surface (Figure 1). There is a nice illustration of this here.

Figure 1. Global land ice. Glaciers are highlighted in yellow, ice shelves in green, ice sheets in white.
Other sources of global ice
There are also small amounts of ice stored in the ground in permafrost regions, frozen lakes and rivers, seasonal snow cover, and so on.
Sea ice (frozen sea water) and ice shelves (frozen floating extensions of land ice; green on Figure 1 above) do not have a “sea level equivalent” of ice volume as they are already floating, so would not raise sea levels on full melting.
Measuring changes in global ice volume
Changes in global ice volume are often expressed in gigatonnes per year (yr-1). A gigatonne is 1,000,000,000 tonnes. 1 km3 water = 1 Gt water; 361.8 Gt of ice will raise global sea levels by 1 mm.
Greenland Ice Sheet
Mass balance of the Greenland Ice Sheet
The Greenland Ice Sheet has been losing mass for over 20 years. The most recent estimates suggest that the Greenland Ice Sheet from 2012 to 2016 had a negative mass balance, losing 247 ± 15 Gigatonnes (Gt) per year of ice volume, contributing 0.69 ± 0.04 mm per year to sea level rise[2]. The mass balance of Greenland has been increasingly negative since 1995, and it is now equivalent to the global contribution to sea level rise from glaciers and ice caps (Figure 2).
 Figure 2. Cumulative ice mass loss from Greenland ice sheet 1992–2012[1] (from IPCC AR5).
Driven by changes in surface mass balance
These changes have largely been driven by changes in surface mass balance. While in Greenland 60% of mass loss is through ice discharge across the grounding line to the ocean (as icebergs or melting in the ocean), 40% of mass loss is from surface melt. Increases in surface melt (ablation) are largely responsible for the increasing melting of Greenland [3].

Figure 3. Surface meltwater on the Greenland Ice Sheet.
The estimates of Greenland Ice Sheet mass balance above include the peripheral glaciers surrounding the larger ice sheet. These peripheral glaciers account for around 15-20% of the total mass imbalance of the ice sheet[2, 4].
These increases in surface melt and mass losses from Greenland are due to recent increases in winter and summer air temperatures, with increases in the size of the ice sheet ablation area (the area with net melting over one year). This is associated with changes in the surface albedo, as ice has a lower albedo than white snow, exacerbating melt. Overall, this is leading to a lowering of the Greenland Ice Sheet surface elevation (Figure 4), and a decrease in ice volume.
Acceleration in outlet glaciers
Ice discharge from the major outlet glaciers of the Greenland Ice Sheet has also increased, with glaciers accelerating in western Greenland (e.g. Jakobshavn Isbrae, JI) (Figure 4). This faster ice flow leads to these outlet glaciers discharging more ice volume to the ocean as icebergs than is replaced by snow, so the outlet glaciers are also thinning, as can be seen by the red on the figure below.

Figure 4. Average rates of surface elevation change (dh/dt) through time (2010-2017) for the Greenland and Antarctic Ice Sheets[2].
Antarctic Ice Sheet
Antarctic Ice Sheet ice volume
The best estimates of Antarctic volume come from BEDMAP2 [5]. BEDMAP2 provides us with a detailed map of the base of the ice sheet, derived mostly from radar data. There are three ice sheets in Antarctica, each with their own unique characteristics. They are the larger East Antarctic Ice Sheet (EAIS), with an SLE of 53.3 m, the West Antarctic Ice Sheet (WAIS), with an SLE of 4.3 m, and the Antarctic Peninsula Ice Sheet (APIS) with an SLE of 0.2 m.

Figure 5. BEDMAP2 (Fretwell et al., 2013; IPCC AR5).
Antarctica surface mass balance
It is very cold in Antarctica, with very limited surface melt [6]. There is abundant accumulation in the coastal parts of Antarctica, especially western West Antarctica and on the APIS. The figure below shows where surface mass balance is highest; reds and yellows indicate far more snowfall than is lost through surface melting. It is cold and dry in the centre of the East Antarctic Ice Sheet, with very little snowfall or surface melt.
The average ice-sheet integrated surface mass balance of Antarctica is +2418 ± 181 Gt yr-1 [6].
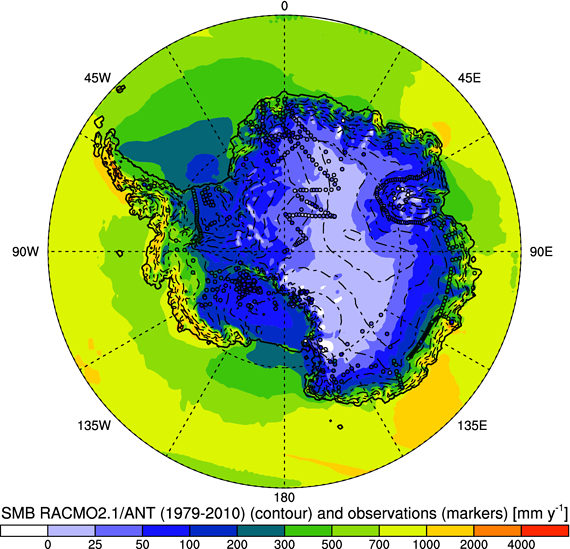
Figure 6. Mean (1979–2010) surface mass balance [mm w.e. y−1]. [6]
Changes in Antarctic mass balance
Most mass loss in Antarctica is driven through ocean melting and iceberg calving[7, 8]. This ice discharge to the ocean through the grounding line is increasing as outlet ice streams are accelerating and grounding lines are retreating (see here). Thus increased ice flow in Antarctica accounts for almost all recent increases in mass losses.
The sea level rise contribution from Antarctica was 0.49 – 0.73 mm yr-1 from 2012-2017, mostly from the APIS and WAIS and due to acceleration of outlet glaciers in Amundsen Sea Embayment (e.g. Pine Island Glacier/Thwaites Glacier) (Figure 4; 7)[2].

Figure 7. Location of Pine Island and Thwaites Glacier in Antarctica, with ice velocity from Rignot et al. 2011
Including ice gained and lost through all mechanisms, the current mass balance of Antarctica from 1992 to 2017 was:
- EAIS: +5 ± 46 Gt yr-1
- WAIS: –94 ± 27 Gt yr-1
- APIS: –20 ± 15 Gt yr-1
- Total Antarctic Ice Sheet: -109 ± 56 Gt yr-1
Antarctic Ice Sheet mass balance changed from 2012 to 2017 to -219 ± 43 Gt yr-1 [8] . Mass losses from West Antarctica are driving most of the total mass losses from Antarctica, with the mass balance of East Antarctica showing negligible changes [8].

Figure 8. Mass changes in Antarctica (Shepherd et al. 2018).
Glaciers and Ice caps
Glacier extent
The amount of ice contained in global glaciers and ice caps is mapped by the Randolph Glacier Inventory[9, 10]. This inventory uses satellite imagery and a formalised methodology to organise researchers working on mapping glaciers and glacier change. The Randolph Glacier inventory estimates that there are 198,000 glaciers worldwide (Figure 9); however, this is an arbitrary number as it depends on:
- Subdivision of glaciers and mapping of ice divides
- Accuracy of the digital elevation model used
- Minimum area threshold; it is hard to map glaciers smaller than 0.2 km2 and so this is usually set as a minimum area threshold. There could be up to 400,000 glaciers if small glacierettes are included (but they only account for 1.4% of glacierised area).
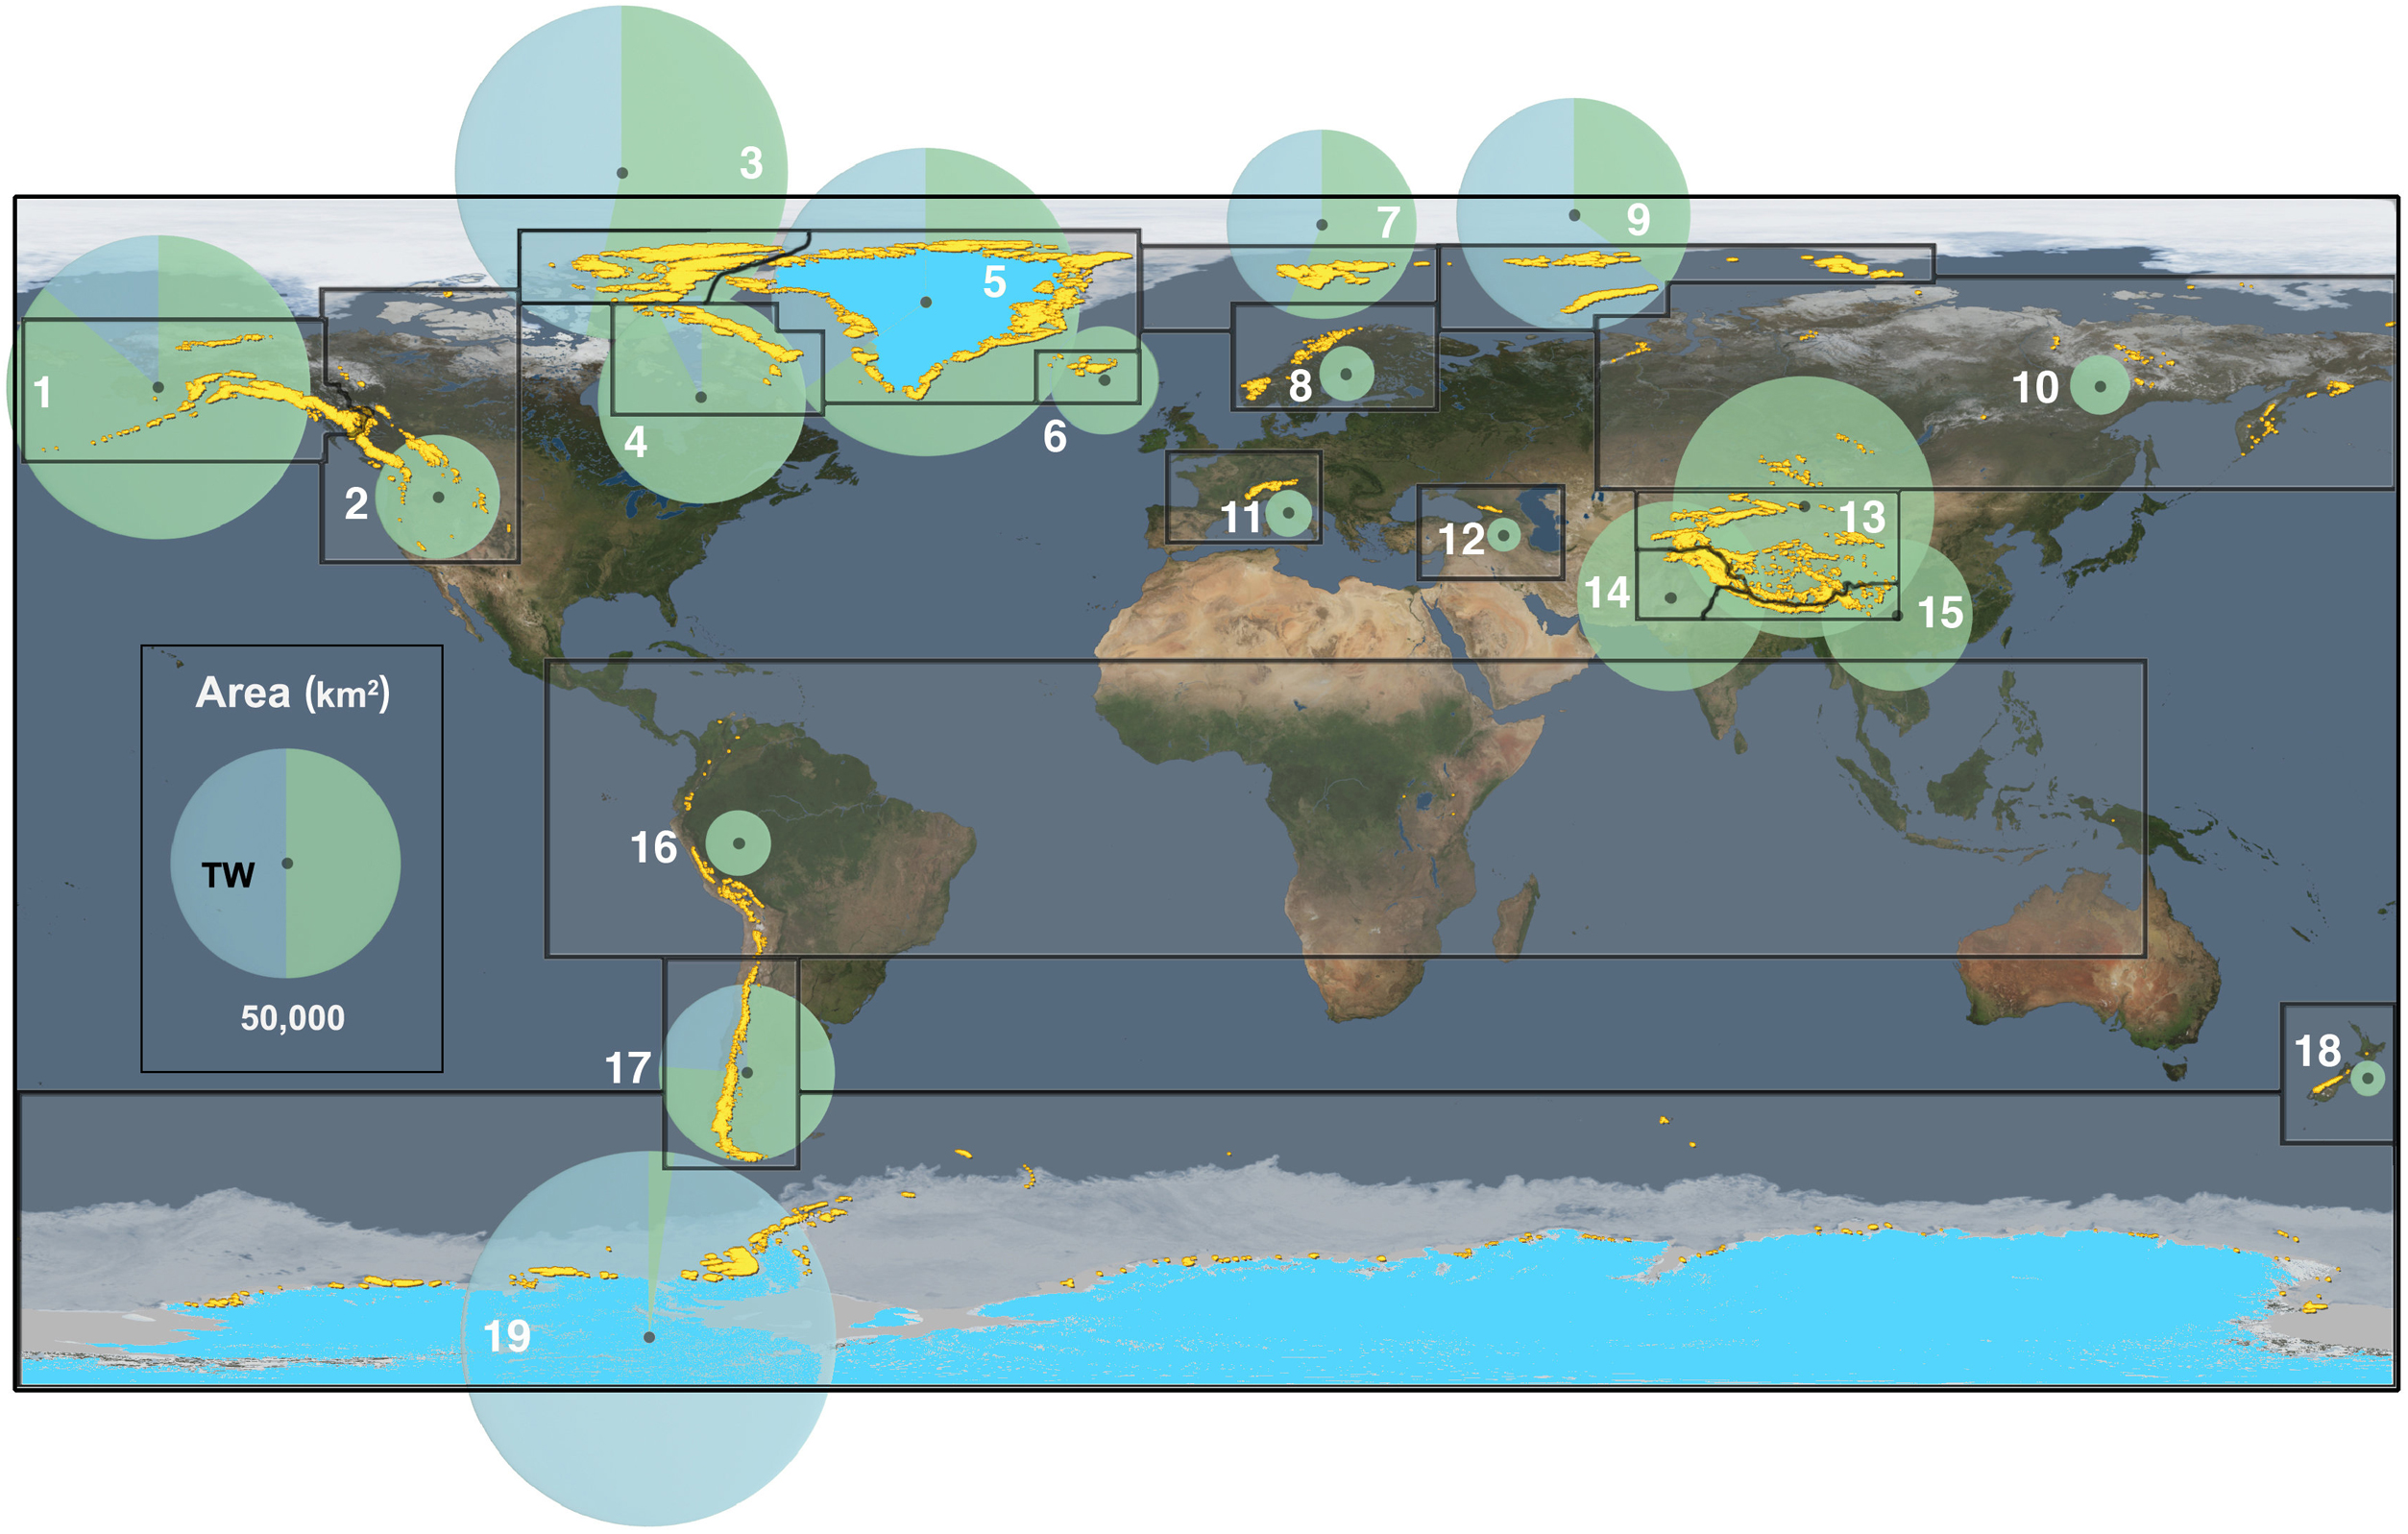
Figure 9. Global glaciers (yellow) and their area (pie charts) [2, 10].
The RGI estimates a total glacierised area of: 726,000 km2
- Subantarctic and Antarctic: 132,900 km2
- Arctic Canada North: 104,900 km2
- Asia: 62,606 km2
- Low latitudes: 2346km2
- 44 % is in Arctic regions, 18% in Antarctic & Subantarctic.
Global glacier ice volume
An estimate of global ice volume in glaciers and ice caps remains a “grand challenge” in glaciology; there are few glaciers with direct measurement by radar [11]. Bed topography and thus ice thickness is usually then estimated, either by volume-area scaling [12, 13], inversions of ice surface slope and velocity [14, 15], or from numerical modelling of ice flow [16].
Our best current estimate of global glacier ice volume is[16]:
- 170 x 103 ± 21 x 103 km3 (moutain glaciers & ice caps outside Greenland & Antarctica)
- = 0.43 ± 0.06 m SLE.
Glacier recession
Glaciers worldwide are receding. The key methods for mapping glacier change include:
- Satellite images (1970s-present)[17]
- Topographic maps (~1900 to present)
- Geomorphological evidence of glacier extent (LIA/sig. advances)
- Automated and manual mapping from satellite imagery
- Limit realistically of mapping glaciers min. 0.2 km2
Mass loss can also be quantified from analysis of glacier surface elevation change (dh/dt)[18, 19] using digital elevation model differencing, satellite gravimetry or altimetry, and in-situ surface mass balance measurements [20].
The figure below shows the current best estimates of ice volumes lost from Antarctica and Greenland from 2012-2016 (taken from Bamber et al. 2018) and from glaciers around the world. Bamber et al. 2018 do not provide an individual assessment of ice volume lost from each area, so here I have plotted ice volumes lost from 2003-2009 from Gardner et al. 2013. Each region corresponds to those mapped out in Figure 9 and glacier outlines are from GLIMS and the Randalph Glacier Inventory.
Note that peripheral glaciers around Greenland and Antarctica are included in the assessment for the ice sheets (cf. Bamber et al. 2018). These glaciers are however changing rapidly, and indeed account for a large portion of the overall change.

Figure 10. Global glacier mass budgets from 2012-2016 by Bamber et al. 2018 (ice sheets) and 2003-2009 (glaciers; Garder et al. 2013).
These data, recently compiled by Bamber et al. 2018, give a global estimate of mass loss from glaciers of -227 ± 31 Gt yr-1 (2012-2016). This does not include losses from peripheral glaciers around Greenland and Antarctica, which are included in the ice sheet mass balance assessments.

Figure 11. Global glacier melt (IPCC AR5)[1]
This has led the World Glacier Monitoring Service (WGMS) to state: “rates of early 21st-century mass loss are without precedent on a global scale, at least for the time period observed and probably also for recorded history” [21].
This global melt is a challenge for society. While the sea level rise from glaciers is ultimately constrained by their small ice volume globally, they remain important as sources of freshwater [22]; their melting poses new hazards to mountain communities[23-25], and they remain important for local economies [26].
Summary
Global changes in land ice volume were recently summarised by Bamber et al. (2018):
| Ice mass | Total ice volume | % Global land surface | Volume change 2012-2016 | Sea level contribution 2012-2016 |
| EAIS | 53.3 m SLE | 8.3% | -19 ± 20 Gt yr-1 | 0.05 ± 0.06 mm yr-1 |
| WAIS & APIS | 4.5 m SLE | -172 ± 27 Gt yr-1 | 0.48 ± 0.08 mm yr-1 | |
| Greenland | 7.36 m SLE | 1.2% | -247 ± 15 Gt yr-1 | 0.69 ± 0.04 mm yr-1 |
| Global glaciers and ice caps* | 0.43 m SLE
(113,915 to 191,879 Gt) |
0.5% | -227 ± 31 Gt yr-1 | 0.63 ± 0.08 mm yr-1 |
| Total | 12.5% | -665 ± 48 Gt yr-1 | 1.85 ± 0.13 mm yr-1 |
*excl. glaciers peripheral to ice sheets
Accelerating mass loss from land ice
Mass loss is accelerating (Figure 12), with changes in ocean melt driving recession in Antarctica, increased ice discharge and surface melt driving changes in Greenland, and negative surface mass balances largely driving glacier recession worldwide. Losses from Greenland are now the most significant contributor to global sea level rise (this includes the peripheral glaciers around the ice sheet), recently overtaking glaciers as the largest contributor.

Figure 12. Mass losses from glaciers and ice sheets, annually (Bamber et al. 2018)
Below is a nice summary of the key changes and processes from the IPCC AR4:

Figure 13. Summary of global changes in land ice, IPCC AR5 (2013).