
By Tamara Gerber
Aniso… what?
Glaciers and ice sheets move by sliding over their bed and by deforming internally under their own weight. How easily the ice deforms depends not only on temperature and stress, but also on the way the ice crystals are arranged. When these crystals become aligned in a preferred orientation, the ice behaves differently depending on direction—a property known as anisotropy.
A simple example of anisotropy is a cat’s fur. Stroke it from head to tail and it feels smooth; stroke it the other way and it feels rougher (and the cat might be less happy). Ice can behave in a similar way: it deforms more easily in some directions than in others.
Because ice flows to a large degree by deforming internally, this directional behaviour can affect both the speed and pattern of glacier flow, and therefore how we understand and predict the behaviour of glaciers and ice sheets.
From crystals to flowing ice
Ice crystals are inherently anisotropic because of their molecular structure. Water molecules form hexagonal rings stacked in layers. The plane of these rings is called the basal plane, and the direction perpendicular to it the c-axis (Fig. 1). Ice deforms most easily by sliding along the basal planes, like a deck of cards. In addition to this mechanical anisotropy, ice crystals are also anisotropic in their thermal and electrical properties [1, 2, 3]. In particular the dielectric anisotropy plays a crucial role in how we can measure anisotropy in glacier ice.
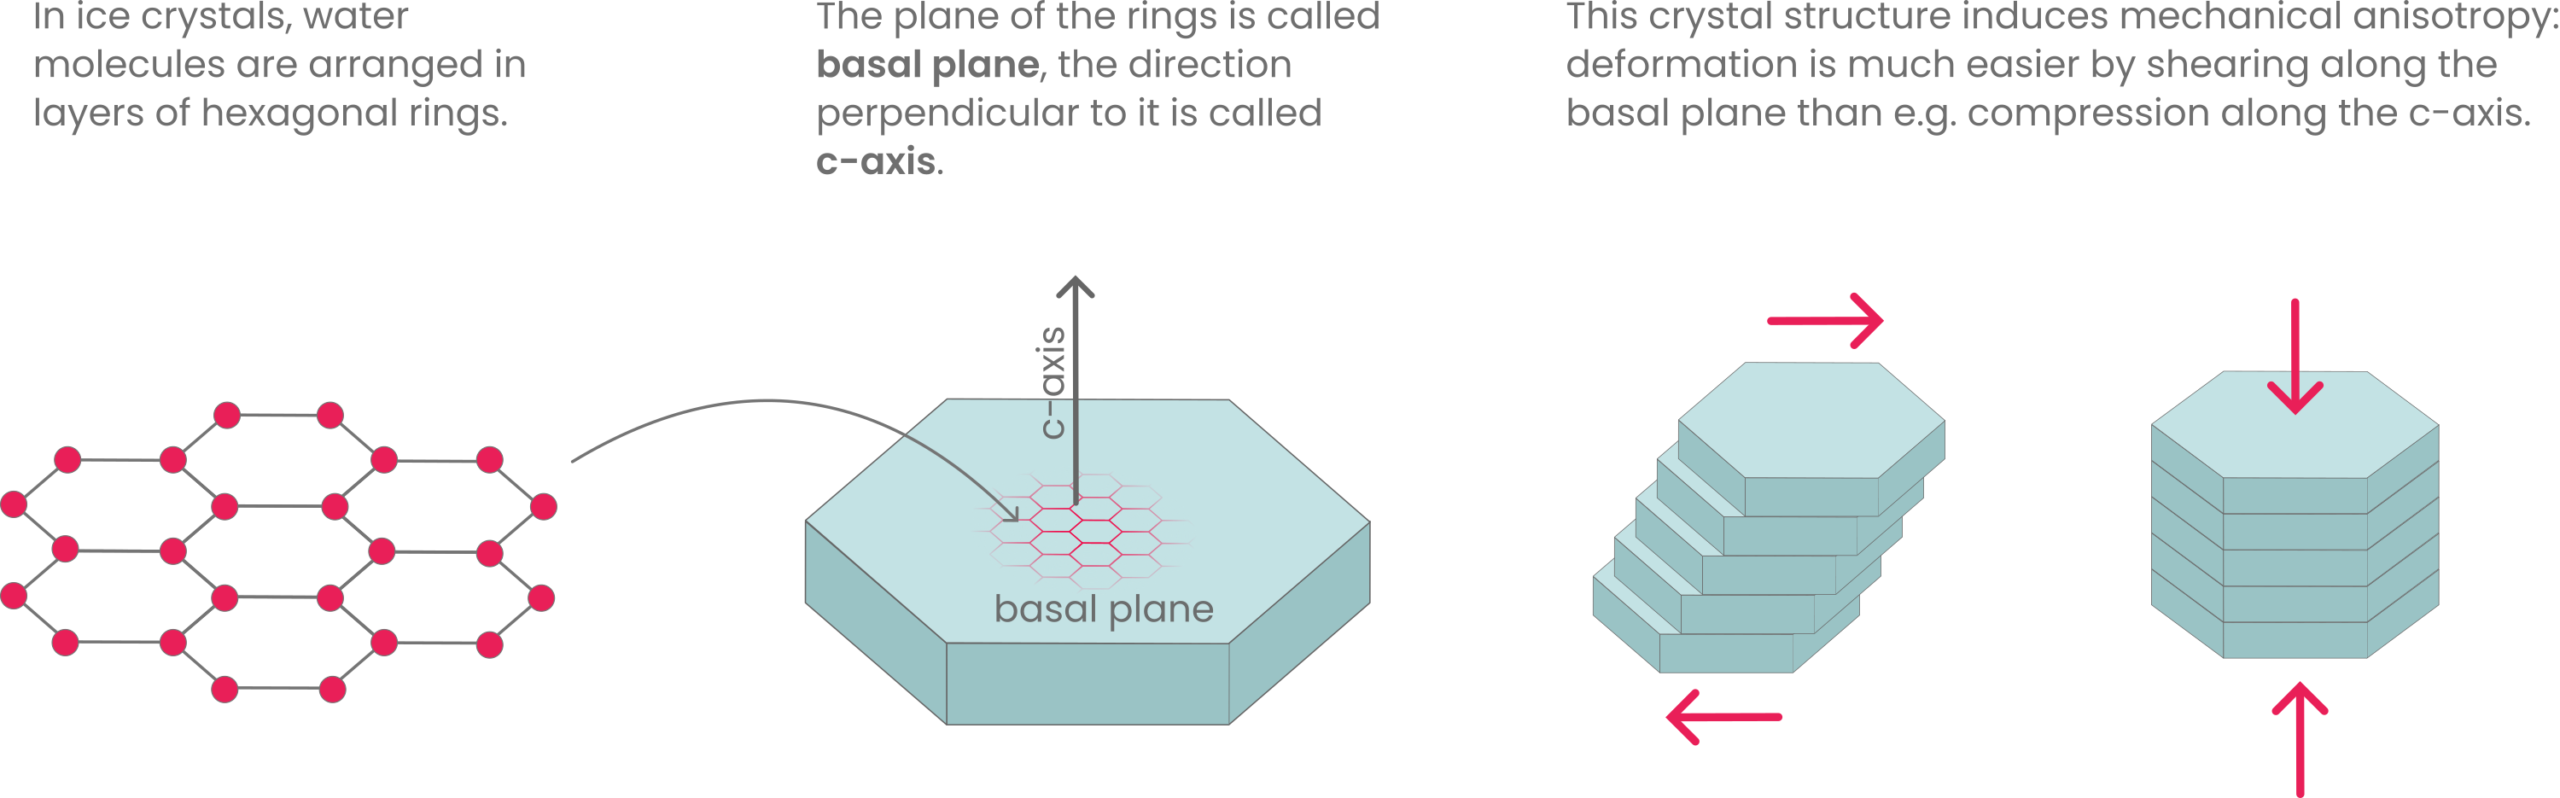
When snow first falls, ice crystals are randomly oriented and their anisotropic properties average out, so the bulk ice behaves almost isotropically (equally in all directions). As snow is transformed to ice and transported by glacier flow, crystals gradually rotate and re-crystallize [6, 7]. Over time, many become aligned, producing an anisotropic crystal orientation fabric (COF), or simply fabric, much like a cat’s fur becomes directional due to the alignment of individual hairs.
The fabric describes how crystal c-axes are distributed in space and is often visualized using stereoplots (Fig. 2). Because the crystal orientation is a result of past deformation it records ice-flow history [8, 9], but also influences how ice deforms today[10]. Measuring crystal orientation in ice sheets therefore helps scientists reconstruct how glaciers and ice sheets flowed in the past and evolved to their present state. At the same time, these observations are used to improve and validate computer models that predict how ice sheets will respond to future climate change and how much they will contribute to sea-level rise.

Measuring fabric in ice cores
Ice cores provide the most direct observations of crystal fabric. Thin sections of ice are analyzed under polarized light, where each crystal appears differently depending on its orientation. Modern fabric analyzers can automatically measure thousands of crystals, revealing how fabric changes with depth [11]. Most ice cores show a transition from randomly oriented crystals near the surface to strongly aligned fabrics at depth.
The resulting patterns depend on the local stress regime: vertical compression produces vertical alignment, while shear leads to c-axis alignment perpendicular to the shear plane, and flow acceleration produces girdle-like patterns with c-axes aligned on a plane perpendicular to ice flow [14, 15, 16, 17].
While ice cores are crucial to understand the ice fabric in detail, they can only provide point measurements and are typically drilled in slow-flowing regions, limiting their ability to capture spatial variability.

Mapping fabric across ice sheets with radar
To extend observations beyond ice cores, scientists use a method called radio-echo sounding (or ice-penetrating radar)[19]. Radar systems send pulses of polarized radio waves into the ice and record echoes from internal layers and the bed. Mounted on aircrafts or sledges, they can survey large regions rapidly.
Because ice crystals are dielectrically anisotropic, radar waves travel at different speeds depending on their polarization (the direction in which the electromagnetic field oscillates) relative to the crystal fabric [2]. Even small differences in wave speed accumulate over the long distances through km-thick ice, causing reflections from the same interface to return with a measurable time delay for different wave polarizations (Fig. 4a,c). This time delay can be used to infer the strength and orientation of the crystal fabric when measurements are made with multiple wave polarizations.
More advanced phase-sensitive radars (pRES) can also track subtle phase changes (i.e. small shifts in the timing of the wave’s oscillation cycle) in the returning signal, in addition to the travel-time delay, allowing fabric to be detected even in thinner ice or where it is weaker [20]. Those phase shifts sometimes also produce birefringence or beat patterns in radargrams, where the signal oscillates due to the interference between two wave components drifting out of phase (Fig. 4b,d), causing distinct stripy patterns that can be used to estimate the fabric strength [21].

From past ice deformation to future change
Radar observations have shown that the fabric in fast-flowing regions such as Thwaites Glacier [22], Whillans Ice Stream[23], and the Northeast Greenland Ice Stream[18] are strongly horizontally anisotropic, and seems to play a critical role in the dynamics of these regions. The fabric tends to stiffen ice in flow direction while facilitating shear along margins (Fig. 5), helping sustain the fast flow that is difficult to explain without anisotropy [18].

Ice-flow models are now increasingly able to simulate fabric evolution explicitly [24, 25]. Together with growing computational power and better observational constraints, this allows anisotropic ice behavior to be included in large-scale simulations used to study ice flow. However, uncertainties remain because radar and field data only partially constrain the full three-dimensional fabric, and converting fabric into ice stiffness still relies on simplifying assumptions [21, 26, 27, 28, 29].
Despite these limitations, the combination of ice cores, radar observations, and modeling is rapidly improving our understanding of the internal structure and dynamics of ice sheets. This is reshaping how ice flow is represented in models and will lead to better representation of fast-flowing regions such as ice streams, and ultimately to better predictions of future ice-sheet evolution and sea-level rise.
Further reading
Two EOS articles on radar polarimetry and how this method can be used to measure fabric in ice sheets:
https://eos.org/science-updates/new-directions-in-mapping-ice-sheet-fabrics-and-flow
https://eos.org/editors-vox/how-radar-reveals-the-hidden-fabric-of-ice-sheets
About the Author

I am Tamara Gerber, a geophysicist and glaciologist specialized in the use of radio-echo sounding to investigate glaciers and ice sheets. My research focuses on understanding their past, present, and future dynamics, and their role in the Earth system. I am particularly interested in addressing these questions through an interdisciplinary approach that combines field observations, remote sensing, and numerical modeling. I am currently a Postdoc at the University of Lausanne.
Beyond research, I am passionate about science communication and enjoy explaining complex scientific concepts in creative and accessible ways, making glaciology engaging and approachable for diverse audiences.