
This is an activity report for AntarcticGlaciers.org in the 12 months to July 2026. This information may be useful for those thinking about online science communication websites.
See also:
Highlights
In total, since inception in 2012, I estimate that the website has had over 6.4 million page views.
In the year to end of July 2026, the website had 566,278 pageviews from 326,322 active users, averaging around 50,000 – 60,000 pageviews in peak months.
Significant new innovations include the major StoryMaps Collection, The Greenland Connection, focused on decolonising the UK-led historical explorations of Greenland.
Website content
As of end of July 2026, the website has:
- 398 webpages
- 150 blog posts
- 76 ‘Answers to your Questions’
- 1603 approved comments
In the 12 months to end of July 2026, we have:
- Published 23 webpages
- Published 7 blog posts
- Content contributed by 7 ECR guest authors, supporting the training of the next generation of science communicators.
Guest contributors
Guest contributors in the last 12 months include Jakob Hamann, Dingyu Xuan, Isabelle Wicks, Kate Winter, Tamara Gerber, and Owen King. All received mentoring, support, training and encouragement for content development, considering intended audiences, writing styles and illustrations. Some were supported by ongoing IAS and NERC Arctic Office funding. Guest author career stage tended towards PhD/ECR, providing an important and ongoing contribution to training the next generation of science writers.
Thank you to all of these contributors.
Ask a Scientist and Answers to your Questions
While these pages remain popular, and I continue to receive queries, I cannot answer all questions received. If you’d like to help, let me know!
Comments, Spam, Hacking
Comments are received frequently and require manual approval. This is because many are spam comments, which may be malicious, or simply trying to put spam links in the comments.
Note that all links in the comments nofollow links, so they won’t help your site!
The website is periodically attacked and security remains critical.
Website analytics
The website remains popular. In the year to 30 July 2026, it received:
| Event name | Event count | Total users |
| Total | 1,822,297 | 326,322 |
| Page views | 566,278 | 323,122 |
| First visit | 319,854 | 320,514 |
| Scroll | 45,138 | 34,949 |
| File download | 1,238 | 934 |
Monthly traffic is around 60,000 pageviews per month (2000-3000/day). Traffic peaks coincide with school and university teaching periods, suggesting regular use within formal education. Traffic begins to dip in June and reaches its low in July, reflecting the summer academic break.
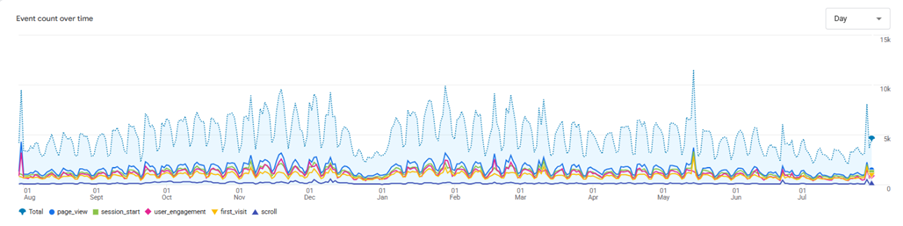
Traffic spikes in December, March and late July are US/UK based and focused on specific pages, which suggests curricular alignment. The traffic spike in March for example was primarily driven by uses from the US, largely landing on /estimating-glacier-contribution-to-sea-level-rise/ page. Most of this traffic was a direct source, suggesting the page was shared in a major educational portal, high-traffic news citation, or classroom.
Anomalous spikes in May are related to users from Singapore and have low engagement times and high direct traffic to the homepage, characteristic of bot crawlers.
Since January 2023, the website has received 1.5 m pageviews in three and half years.
Overall, I estimate that the website has received at least 6.4 million pageviews since inception, not including visitors during a Google Analytics data gap from October 2023-April 2024.
Most visited pages
Glacier processes and types has a high engagement rate, and there is significant interest in the “changing Greenland ice sheet” and “West Antarctic Ice Sheet” sections.
Wildlife of Antarctica and Ice Core Basics remain the strongest entry points for users, consistently appearing as the top landing pages during high traffic periods.
| Views | Active users | |
| Total | 566,278 | 325,815 |
| / | 33,405 | 19,746 |
| /glaciers-and-climate/ice-cores/ice-core-basics/ | 23,534 | 16,755 |
| /antarctica-2/introductory-antarctic-resources/wildlife-of-antarctica/ | 12,136 | 9,098 |
| /glacial-geology/glacial-landforms/glacial-depositional-landforms/moraine-types/ | 11,470 | 9,176 |
| /glaciers-and-climate/changing-greenland-ice-sheet/greenland-ice-sheet/ | 10,601 | 8,571 |
| /glaciers-and-climate/observing-and-monitoring-glaciers-and-ice-sheets/mapping-worlds-glaciers/ | 9,931 | 7,670 |
| /antarctica-2/people-in-antarctica/living-and-working/ | 7,980 | 6,298 |
| /glaciers-and-climate/glacier-hazards/glacial-lake-outburst-floods/ | 7,609 | 5,418 |
| /glaciers-and-climate/what-is-the-global-volume-of-land-ice-and-how-is-it-changing/ | 7,463 | 5,909 |
| /antarctica-2/introductory-antarctic-resources/seasons-of-antarctica/ | 7,369 | 5,738 |
User Acquisition
User acquisition is predominantly through organic search (65.31%), followed by direct traffic (29.9%). Referral traffic makes up 3.36% of the user acquisition, followed by organic social (0.88%). This is a strong organic search performance.
There is a growing and highly engaged audience coming from AI assistants and niche search engines (such as educational platforms like Nearpod). Google and organic search traffic has a high engagement rate (49.6%), with users staying nearly 3 minutes on average.
| Total users | New users | Returning users | Engagement rate | |
| Total | 326,322 (100%) | 319,854 | 46,361 | |
| Organic search | 213,107 (65.31%) | 209,132 | 36,072 | 49.43% |
| Direct | 97,563 (29.9%) | 95,066 | 7,196 | 25.46% |
| Organic social | 2,886 (0.88%) | 2,880 | 116 | 27.94% |
| Unassigned | 1,435 (0.44%) | 1,432 | 142 | 33.81% |
| 126 (0.04%) | 126 | 4 | 38.52% |
Tracking of origin shows that a google search remains the most common way for people to find the website. Nearpod is an educational platform that had the highest engagement rate (56%), confirming the site’s strong value in classroom settings.
| Active users | Sessions | |
| 203,442 | 297,475 | |
| Bing | 5,876 | 9,732 |
| Chaptgpt.com | 4,048 | 6,232 |
| Ecosia.org | 1,565 | 2,807 |
| Duckduckgo | 1,165 | 1,835 |
| App.nearpod.com | 1,015 | 1,259 |
| Gemini.google.com | 842 | 1,218 |
Global reach
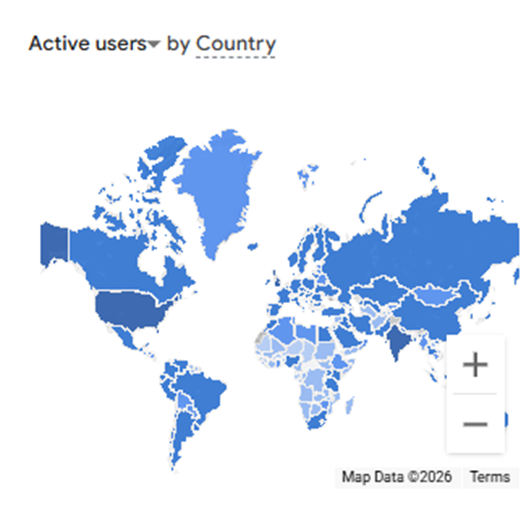
In the last 12 months, users came from a total of 223 different countries and territories, with the United States (117,924 users) and United Kingdom (39,503 users) being the top contributors.
This wide distribution highlights the global relevance of the content, reaching almost every recognised country. This global reach is consistent with the website’s role as an international educational resource.
| Country | Active users | New users | Engaged sessions | Engagement rate |
| Total | 325,815 | 319,854 | 199,164 | 43.48% |
| United States | 117,924 (36.19%) | 116,823 | 69,872 | 43.48% |
| United Kingdom | 39,503 (12.12%) | 38,523 | 31,717 | 47.62% |
| India | 24,767 (7.6%) | 24,378 | 12,330 | 39.36% |
| China | 19,197 (5.89%) | 18,858 | 2,009 | 9.94% |
| Canada | 16,820 (5.16%) | 16,690 | 11,897 | 49.11% |
| Singapore | 15,238 (4.68%) | 6,566 | 2,827 | 17.96% |
| Australia | 12,427 (3.81%) | 12,455 | 8,866 | 47.05% |
| Germany | 5,055 (1.55%) | 4,938 | 3,674 | 25.35% |
| New Zealand | 3,784 (1.16%) | 3,730 | 3,227 | 49.87% |
| Brazil | 3,570 (1.1%) | 3,342 | 2,300 | 48.69% |
Traffic from China is largely direct traffic, with users landing on deep educational content such as /glacial-processes/ and /ice-streams/. This suggests the site is being shared in curriculum lists or academic forums. Users from the United States and United Kingdom have exceptional engagement.
Engagement
The ‘Engagement rate’ is the percentage of active, involved visits to the website. It measures how many people actually interacted with the website, rather than immediately leaving (replacing the old ‘bounce rate’). An interaction is called an ‘engaged session is the user does at least one of the following: staying longer than 10 seconds, viewing 2+ pages, or triggering a key event. High engagement means the content matches user expectations.
There is strong evidence of deep engagement, with users not only visiting, but actively researching and spending significant time with the technical content.
For example, in July 2026, the average session duration was 118 seconds (nearly two minutes), which is consistently high for educational content. The engagement rate overall was 40.5%; this means that 40.5% of the sessions were considered ‘engaged’. On average, each active user views 1.52 pages, showing they are navigating through the pages.
The table below shows average engagement for top performing pages for 30 days (June 30-July 30th, 2026):
| Page path / query | Average engagement |
| “why are glaciers important” | 13 m 20s |
| /glacial-geology/Laurentide-ice-sheet/deglaciation-of-the-Laurentide-ice-sheet-and-the-younger-dryas | 10m 02s |
| /glaciers-and-climate/changing-antarctica/glaciers-and-climate-change | 9 m 23 s |
| /2025/05/activity-report-may-2025/ | 8m 46s |
| /glacier-processes/glacier-types/ice-shelves-sea-ice-icebergs | 6m 50s |
| /antarctica-2/antarctica/ | 5m 40s |
| Glacial-geology/british-irish-ice-sheet/last-glacial-maximum/the-last-ice-sheet-in-the-north-sea | 5m 27s |
Over the last year, the pages with the highest engagement rates are typically the most technical and structural pages; e.g. Glaciofluvial Landforms has an engagement rate of 89.5%. The About Us page also has a very high engagement rate (88.8%), showing that users who want to know who is behind the website are very committed.
Some pages are high-performance hubs, acting as central pillars for the site and combining high volume and strong engagement (e.g. Glacier Processes, Antarctica and Glacial Geology).
The top 10 pages are, for the 12 months to end of July 2026:
| Page/path | Engagement rate | Sessions |
| /glacial-geology/glacial-landforms/glaciofluvial-landforms | 89.54% | 526 |
| /about-2/ | 88.8% | 759 |
| /author/bethan/ | 86.24% | 567 |
| /glacial-geology/British-irish-ice-sheet/last-glacial-maximum | 84.8% | 684 |
| /glaciers-and-climate/ | 83.71% | 3.1k |
| /glacier-processes/glacier-types/ | 82.35% | 612 |
| /antarctica-2/ | 79.61% | 1.7k |
| /glacial-geology/ | 78.87% | 1.8k |
| /students-3/careers/ | 77.87% | 619 |
| /glacier-processes/ | 77.44% | 1.9k |
User stickiness
User stickiness refers to daily, weekly and monthly average users (DAU, WAU, MAU) and represents how often people return to the site.
Over the last 12 months, the stickiness ratio shows a healthy and consistent pattern of engagement. DAU/MAU typically ranges from 15-23%, indicating that users return multiple times per month during their active periods.
DAU/WAU often exceeds 50%, meaning that once a user becomes active in a given week, they are highly likely to visit for several days in a row. Overall, the site has excellent retention for its niche, with a high DAU/WAU ratio where users return daily to complete a specific task.
| Metric | Annual average (12 months to end July 2026) | What this means |
| DAU/MAU | 20.1% | On average, the monthly audience visits the site about 6 days out of every 30. |
| DAU/WAU | 53.4% | Once a user becomes active in a given week, they visit for an average of nearly 4 days. |
| WAU/MAU | 37.6% | Over one third of the monthly audience returns to the site at least once per week. |
In general, a DAU/MAU of above 15% is considered excellent for non-social media platforms. The DAU/MAU ratio of 20.1% is in the top tier of scientific educational sites.
User stickiness is concentrated in academic research cycles, where pages are used intensively for a week or more at a time.
Referrals
Backlinks to the site include multiple universities and schools, who typically have excellent engagement, staying on the site for many minutes.
In addition to direct university portals, the site is shared through classroom delivery tools such as Nearpod, Schoolology and Firefly.
Highly authoritative and scientific bodies are also linking to the pages, including NASA (science.nasa.gov and earthobservatory.nasa.gov), National Geographic (nationalgeographic.com), Smithsonianmag.com, Wikipedia and the Royal Geographical Society.
Thank you to all who have contributed to, visited, and used content from AntarcticGlaciers!
I really like seeing programs that give emerging science writers practical mentoring, training, and encouragement. Supporting PhD and early-career researchers in developing their communication skills can make a lasting difference to the next generation of science communicators.