In these interactive webmaps, you can explore the Laurentide Ice Sheet through time. The maps are based on the shapefiles and datasets produced by Dalton et al. 2023.
The maps are based on a radiocarbon chronology and are presented in calibrated thousands of years before present (cal. ka BP).
The Last Glacial Maximum
This map shows the Laurentide Ice Sheet at the Last Glacial Maximum. It is focused on the Great Lakes and Finger Lakes of North America, which are an example of ellipsoidal basins.

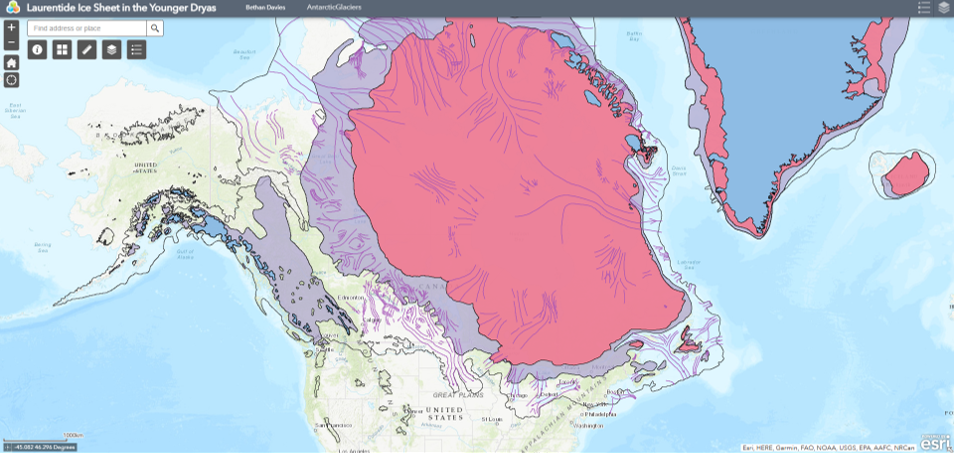
The Younger Dryas
This map shows the extent of the ice sheet at different time steps. By default it shows the ice at the Last Glacial Maximum (black outline) (18-22.1 cal. ka BP), 11.5-13.5 cal. ka BP (purple), 11.5-10.0 cal. ka BP (red) and 0.9-1.0 cal. ka BP (blue), but you can turn different time steps on and off in the layer list.