Marine ice sheet instability
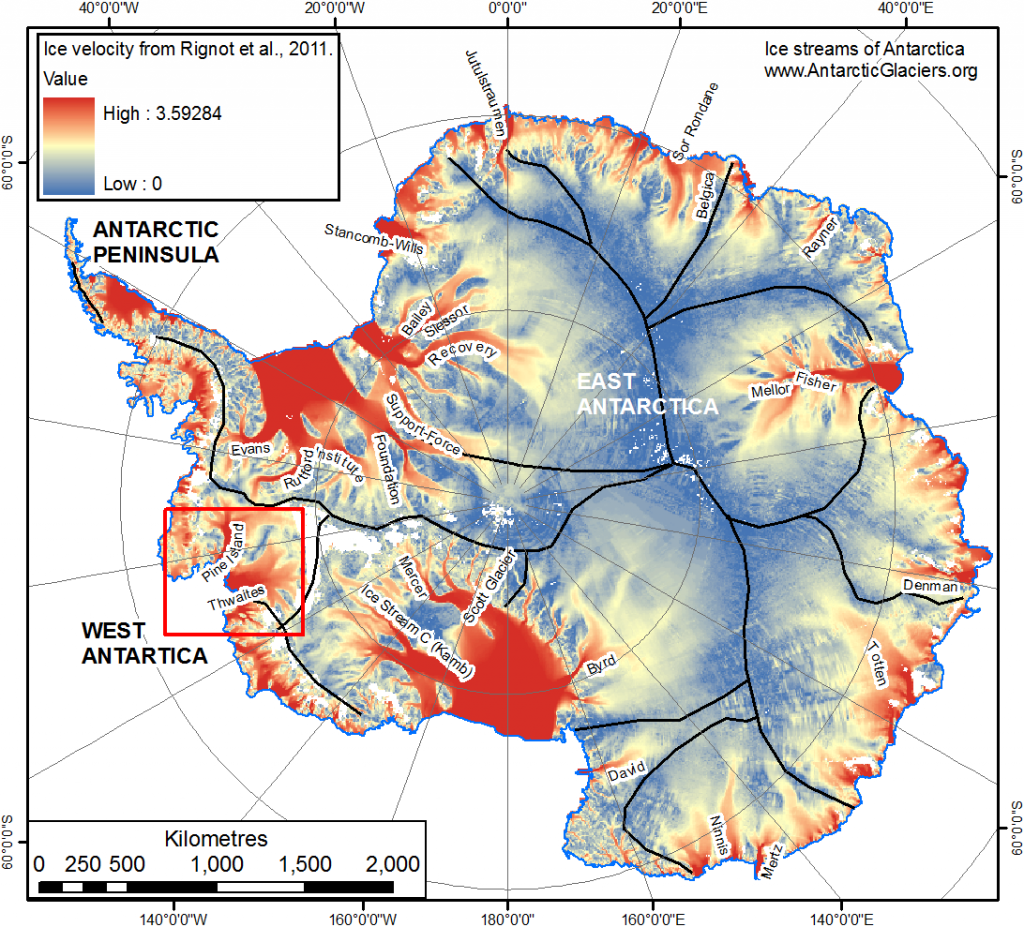
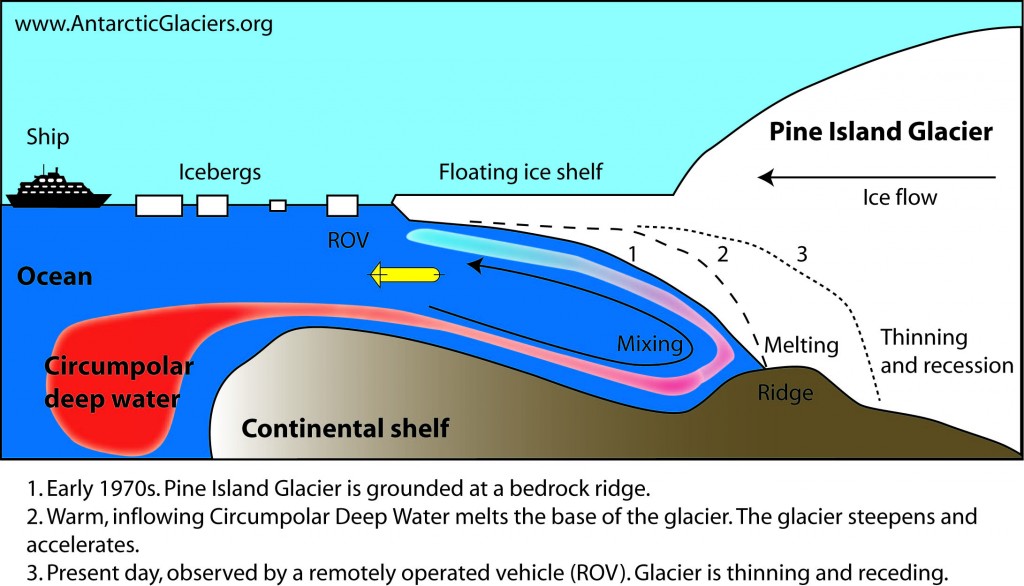
The West Antarctic Ice Sheet (WAIS) is the world’s most vulnerable ice sheet. This is because it is grounded below sea level, and marine ice sheets such as these are susceptible to rapid melting at their base. Fast-flowing ice streams draining the WAIS (Pine Island Glacier and Thwaites Glacier in particular) into the Amundsen Sea have a grounding line on a reverse bed slope, becoming deeper inland. Recession of the grounding line means that the ice stream is grounded in deeper water, with a greater ice thickness. Stable grounding lines cannot be established on these reverse bed slopes1, because ice thickness is a key factor in controlling ice flux across the grounding line. Thicker ice in deeper water drives increased calving, increased ice discharge, and further grounding-line recession in a positive feedback loop2, 3. This process is called Marine Ice Sheet Instability4.

Ice shelf collapse
The situation is exacerbated by ice shelf collapse. Floating ice shelves5 provide back stress, supporting the ice streams6, 7. If they thin and melt away, this support is removed, leading to increase ice discharge, accelerated flow, grounding line recession8, 9, 10, and marine ice sheet instability. These ice shelves are being thinned from below as they are warmed by Circumpolar Deep Water11, which is being increasingly transported onto the continental shelf12, 13, 14. Glacial troughs, excavated throughout maximum glaciations over the last 2 million years, provide a major route for Circumpolar Deep Water to access the ice shelves11. Pine Island Glacier’s ice shelf in particular is currently accelerating, thinning and receding13, 15.

Scientists fear that the large ice streams draining the WAIS into the Amundsen Sea, particularly Pine Island Glacier and Thwaites Glacier, could be becoming unstable. But what is the risk of this actually happening, and what does it mean in terms of sea level rise?

Observations of marine ice sheet instability

A recent study by Mouginot and colleagues detected acceleration and increased ice discharge. Flow speeds have increased dramatically since 1973, and much of this increase occurred between 2009-201316. The large acceleration in ice velocity and ice discharge in Pine Island Glacier from 2002-2008 coincided with rapid recession of its grounding line. This speed-up is spreading far inland, and it indicates a strong link between glacier recession and the observed ice-shelf melting. The authors herald this as the start of marine ice sheet instability. They state that these changes are a possible sign of a progressive collapse of these ice streams, in response to the high melting of their buttressing ice shelves.
Predicting future ice stream behaviour
A second study published this week by Ian Joughin and colleagues looks at the future of the WAIS. They use computer models to investigate the sensitivity of Thwaites Glacier to ocean melt, and to determine whether the current recession is unstable17. They found that early-stage collapse had already begun, and that the ice stream exhibited threshold behaviour. Once melt passed 1 mm per year, rapid collapse (within decades) occurred as the grounding line reached the deepest parts of the marine basin (for reference, total global sea level rise today is ~3 mm per year, so this is a significant contribution!). The highest-melt simulations pass the threshold of 1 mm per year within 250 years. For all but the very lowest melt simulations, this critical threshold was passed within 1000 years.
Observed ice losses from 1995-2013 fall within the range predicted under the highest melt scenarios for this modelling experiment. The early stages of the highest-melt simulations therefore reasonably approximate present conditions. These simulations provide strong evidence that the process of marine-ice sheet instability is already underway on Thwaites Glacier, largely due to the observed high sub-ice shelf melt rates. Rapid losses of 1 mm per year will ensue once the grounding line reaches the basin’s deepest parts, which could occur within two centuries. Once this threshold is passed, rapid ice sheet collapse could occur, which would spill over into other basins and perhaps spell an end for the West Antarctic Ice Sheet. This process is difficult to accurately model, but rapid ice sheet collapse would certainly result in dramatically higher rates of sea level rise once this critical threshold is passed.
This numerical model suggests that a full-scale collapse of this sector of the West Antarctic Ice Sheet may be inevitable. But it leaves a large uncertainty in the timing; more complex coupled ice-sheet and climate models are needed to model this more thoroughly in the future.
Two studies, one result
Thus two completely independent studies, using completely different methods, both find that the early stages of marine ice sheet instability may be underway in West Antarctica. Unless the Circumpolar Deep Water recedes enough to reduce melt well below today’s levels, we may be seeing an irreversible process that could result in dramatic ice stream recession. Given that the West Antarctic Ice Sheet has a total sea level equivalent of 3.3 m1, with 1.5 m from Pine Island Glacier alone4, marine ice sheet collapse could be a significant challenge for future generations, with major changes in rates of sea level rise being possible within just the next couple of hundred years.

Great summary. Thank you
I think the recent Favier paints a similar picture of the region.
Favier et al. (2014). Retreat of Pine Island Glacier controlled by marine ice-sheet instability, Nature Climate Change, 4, 117–121 doi:10.1038/nclimate2094
http://www.glaciology.net/Home/Miscellaneous-Debris/howvulnerablearemarinebasedsectorsofantarctica
Your reference list does not do justice to the early work that identified this issue of potential marine ice instability that could lead to collapse. These studies pointed the way to investigating the Pine Island Glacier 30 years ago. Hughes (1973 and 1975) and Thomas (1979) for example. This also shows we have understood the general glacier dynamics for quite sometime and were in the right place to observe the beginning of the collapse.
Hughes, T.]. 1973. Is the West Antarctic ice sheet disintegrating? Journal of Geophysical Research, Vol. 78, No. 33, p. 7884-910
Hughes, T. ]. 1975. The West Antarctic ice sheet: instability, disintegration, and initiation of ice ages. Reviews of Geophysics and Space Physics, Vol. 13, No. 4, p. 502-526
http://www.igsoc.org/journal.old/24/90/igs_journal_vol24_issue090_pg167-177.pdf
I’ve been trying to find an explanation for why a glacier that sits in a bowl should become *more* unstable as it melts. To the rank amateur (me) the mental image makes no sense. Presumably, even if it’s all water, it’ll just sit in the bowl.
This is the first site I’ve come across that actually explains how the process works. And that process is truly terrifying. But thanks for the clarity anyway!
beautifully explained, makes perfect sense to me. thank you.
Mouginot? That was slightly confusing at first glance. Rignot is the lead and corresponding author.
Nice post overall, but your use of conditional language seems hard to justify given the findings of the two papers. Neither lead author has been so hesitant about the irreversibility.
OTOH without the conditionals Revkin might not have linked to you. :/
“Thicker ice in deeper water drives increased calving, increased ice discharge, and further grounding-line recession in a positive feedback loop.” As a general matter, yes, but AIUI the increasing height (depth) of the ice face is the key factor for accelerating retreat of these glaciers since it creates more surface area for the warm water to work on.
Mouginot is the lead author so it is appropriate to cite him in the post.
I think I will need to write a longer post defending my ‘reticent’ ‘conditional’ language!
Thanks, Bethan, I look forward to that.
Re the paper, Rignot was lead on the one “published this week” that’s been getting all the attention. Mouginot was lead on a related paper published (also in GRL) a couple months ago. I haven’t read either yet, but the potential for conflating them is obvious.
And of course it’s the latter that’s in your references, which I should have looked at before. But didn’t the new paper add something worth mentioning?
And with the deeper ice face, the “water lift” effect increases (like an air lift). The melting ice on the front freshens the sea water in contact with the ice front, making it lighter. This fresher water flows up the underside of the slope and out onto the surface of the surrounding sea. Of course, this sucks in sea water with its calorific content to melt more ice. This process should be independent of the season of the year and the fresher water flowing out on the surface may help to explain the increase in sea ice. Not only is the fresher water easier to freeze but the current could push ice northward, opening up leads which can then freeze. It would be interesting to drill holes in the floating ice shelf and put current meters just below the ice to see what is the magnitude, if any, of a seaward current.
And Mercer, Mauri?
Indeed, thank you for highlighting this excellent paper! If anyone would like to read Mercer 1978, see here: https://courses.seas.harvard.edu/climate/eli/Courses/global-change-debates/Sources/18-West-Antarctic-ice-sheets/nature_mercer_1978_wais.pdf
If the grounding line retreat is irreversible, how did the grounding line advance as far as it did in the first place?
Marine ice sheet instability is a classic example of hysteresis. A positive feedback cycle is initiated, which leads to a number of changes that reinforce the intial perturbation. In this case, incursions of circumpolar deep water onto the continental shelf are melting the ice stream at its base and encouraging grounding line recession, which results in a positive feedback loop and further grounding line recession. However, a change in ocean circulation could result in these currents not flowing so far onto the continental shelf. This melt may then reduce and the grounding line recession may halt. This is noted in the published paper.
I suppose that as the under side of the glacier melts, the resulting fresh water mixes with the adjacent salt water, making it lighter and causing it to flow upwards along the under side of the ice. This will pull new warm denser water in under the ice to melt even more.
The melt rate is in a sense analogous to an air lift. In an Air lift, air is introduced into a pipe, making the column of water in the pipe less dense than the water outside the pipe. This density difference powers the water up the pipe and the deeper the mouth of the pipe, the greater suction such a pipe can exert. Below the West Antarctic ice sheet, as the ice melts it produces fresh water which mixes with the adjacent sea water. This mix is lighter than the surrounding water and flows up the slope. This sucks in more water from the ocean which in turn is freshened and flows up the slope. Since there is a reverse slope as you go landward, the grounding line gets deeper and deeper. The deeper it is, the stronger the current and the faster the melt. The collapse rate should accelerate. Incidentally, this may explain part of the increase of Antarctic floating ice. The fresher water on the surface freezes more easily, increasing ice extent. This very increase may signal the acceleration of the collapse of the West Antarctic ice shelf.
You need to divide your 57.7 meter sea level rise by ( 0.7096 ), the surface area of the oceans in comparison to the surface area of the Earth.
57.7 / 0.7096 = 81.3 meters with out land encroachment.
With Land Encroachment it will be about 80 to 81 meter sea level rise.
All those people who paid big bucks to buy up all the ocean front property at 60 meters above sea level are really going be unhappy with 20 meters of salt water over their heads.
As an a side, I am looking for a person to work with Atmospheric Pressure, Temperature, Gravity, Lapse Rate Equations for the Period between 150.0 Mya to 30 Mya in 5 Million Year steps. I can also fill in the Equations in 1.0 Million Year Increments. These Equations, IF CORRECT, will predict the commencement of glaciation in Antarctica, and the progressive increase in Glaciation as Surface Pressures decrease, and Surface Temperatures decrease with elapsed time in million year increments.
Are you interested, or, do you know of someone who works with Pressure Altitude, and Temperature Altitude Equations, in Prior Geologic Time Periods ?
The issue is what is the time line for the sea level rise? Are we talking decades, centuries or millennia for the effects to be seen. All this research is couched in language of high uncertainty “This numerical model suggests that a full-scale collapse of this sector of the West Antarctic Ice Sheet may be inevitable. But it leaves a large uncertainty in the timing; more complex coupled ice-sheet and climate models are needed to model this more thoroughly in the future.” Modelling is helpful but as the IPCC modelling has shown it is very unreliable to the point of being fantasy speculation in the IPCC case. When we don’t have good data and don’t understand the processes involved to a high degree of certainty models can quickly produce garbage.
Hi Kevin,
Thanks for your question. We are observing the effects of sea level rise on a yearly basis, but also over the coming decades we are expecting much more. Numerical models do face some uncertainties, however they are the best tool we have to project how ice is changing and the sea levels are rising.